Investment Approach
- Fidelity® Select Industrials Portfolio is a sector-based equity-focused strategy that seeks to outperform its benchmark through active management.
- We believe that uncertainty provides investment opportunity. Stock prices can become disengaged from a company’s intrinsic (fair) value at cyclical extremes because of investor overreaction.
- Cyclical stocks exhibit repeatable patterns. We believe this can present opportunities for a disciplined investor whose time horizon spans the next cycle.
- We strive to capitalize on these opportunities through intensive, academic-style research on cyclical drivers and company-specific fundamentals, along with disciplined portfolio construction. The fund’s success is predicated on finding the right mix of undervalued cyclicals and more- consistent earnings growers throughout the cycle.
- Sector strategies could be used by investors as alternatives to individual stocks for either tactical- or strategic-allocation purposes.
|
PERFORMANCE SUMMARY |
Cumulative |
Annualized |
||||
|
3 Month |
YTD |
1 Year |
3 Year |
5 Year |
10Year/LOF1 |
|
|
Select Industrials Portfolio Gross Expense Ratio: 0.69%2 |
11.55% |
25.15% |
43.69% |
14.80% |
13.67% |
11.07% |
|
S&P 500 Index |
5.89% |
22.08% |
36.35% |
11.91% |
15.98% |
13.38% |
|
MSCI US IMI Industrials 25/50 Linked Index |
10.87% |
19.10% |
35.28% |
13.12% |
13.95% |
11.91% |
|
Morningstar Fund Industrials |
10.06% |
14.89% |
29.61% |
8.59% |
11.06% |
11.18% |
|
% Rank in Morningstar Category (1% = Best) |
— |
— |
18% |
17% |
29% |
63% |
|
# of Funds in Morningstar Category |
— |
— |
48 |
43 |
42 |
32 |
1Life of Fund (LOF) if performance is less than 10 years. Fund inception date: 03/03/1997.
2This expense ratio is from the most recent prospectus and generally is based on amounts incurred during the most recent fiscal year, or estimated amounts for the current fiscal year in the case of a newly launched fund. It does not include any fee waivers or reimbursements, which would be reflected in the fund’s net expense ratio.
Past performance is no guarantee of future results. Investment return and principal value of an investment will fluctuate; therefore, you may have a gain or loss when you sell your shares. Current performance may be higher or lower than the performance stated. Performance shown is that of the fund’s Retail Class shares (if multiclass). You may own another share class of the fund with a different expense structure and, thus, have different returns. To learn more or to obtain the most recent month-end or other share-class performance, visit Fidelity Funds | Mutual Funds from Fidelity Investments, Financial Professionals | Fidelity Institutional, or Fidelity NetBenefits | Employee Benefits. Total returns are historical and include change in share value and reinvestment of dividends and capital gains, if any.Cumulative total returns are reported as of the period indicated. For definitions and other important information, please see the Definitions and Important Information section of this Fund Review.Stock markets, especially foreign markets, are volatile and can decline significantly in response to adverse issuer, political, regulatory, market, or economic developments. Industrial industries can be significantly affected by general economic trends, changes in consumer sentiment and spending, commodity prices, legislation, government regulation and spending, import controls, worldwide competition, and liability for environmental damage, depletion of resources, and mandated expenditures for safety and pollution control. Foreign securities are subject to interest rate, currency exchange rate, economic, and political risks. The fund may have additional volatility because of its narrow concentration in a specific industry. Non-diversified funds that focus on a relatively small number of stocks tend to be more volatile than diversified funds and the market as a whole. |
Market Review
For the three months ending September 30, 2024, the industrials sector, as measured by the MSCI U.S. IMI Industrials 25/50 Index, advanced 10.87%, while the broad-based S&P 500® index finished with a 5.89% gain. In July, the stock market rally pivoted away from technology stocks and into cyclical and interest-rate-sensitive shares, which benefited the industrials sector. During Q3, there was a growing consensus that the Federal Reserve would cut rates at its September meeting, which it did. Lower rates were expected to spur economic growth and help industrial companies, despite ongoing weakness in much of the sector.
Overall, industrials finished with the third-best return among the 11 S&P 500® sectors, trailing only utilities and real estate. Information technology, which had been the market’s top-performing sector in the first six months of 2024, settled for 10th place in Q3, outpacing only energy. Industrial stocks continued to be supported by a number of “mega-projects” – that is, projects costing at least $1 billion – that are still largely in the planning stages.
Looking at major groups within the MSCI industrials index, aerospace & defense posted a roughly 14% gain for the quarter, despite an approximately -16% showing by Boeing. The group was helped by other components, such as General Aerospace (+19%, formerly General Electric (GE)), which is focused on manufacturing and repairing jet engines, as well as aerospace and defense conglomerate RTX (RTX) (+21%), and major defense contractors Lockheed Martin (LMT) (+26%) and Northrop Grumman (NOC) (+22%).
Elsewhere the industrial machinery & supplies & components segment climbed roughly 12% during the quarter, while building products saw an 18% rise. The top-performing group was heavy electrical equipment (+45%), driven by the result of GE Vernova (GEV) (+49%), a supplier of power equipment spun off from General Electric in early April. At the other extreme, the worst-performing group in the index was air freight & logistics (-0.2%), the only industry segment to fall below break-even for the quarter. United Parcel Service (UPS) (+0.9%) and FedEx (FDX) (-8%) were both part of this category.
Performance Review
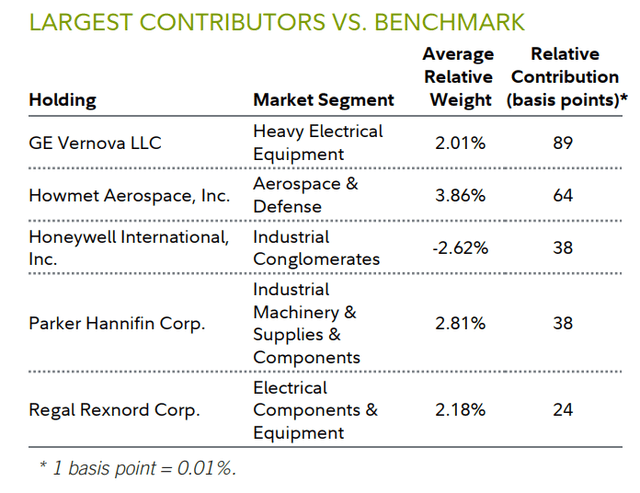
For the third quarter, the fund returned 11.55%, topping the fund’s sector benchmark, the MSCI U.S. IMI Industrials 25/50 Index, as well as the S&P 500®.
Turning to the fund’s performance, a sizable overweight in heavy electrical equipment – via our stake in GE Vernova – lifted performance most versus the MSCI sector index. The shares gained about 49% the past three months, as the power-generation business that split from General Electric on April 2 continued to fare well as a stand-alone entity. On July 24, the company reported quarterly earnings that were better than expected, boosted by its natural gas power-turbine business.
Shares of jet engine components maker Howmet Aerospace (HWM) rose roughly 29% the past three months, rewarding the fund’s large overweight position. In July, management announced that Q2 financial results exceeded expectations, with earnings surging by 52% due to robust demand for travel and an aging global aircraft fleet.
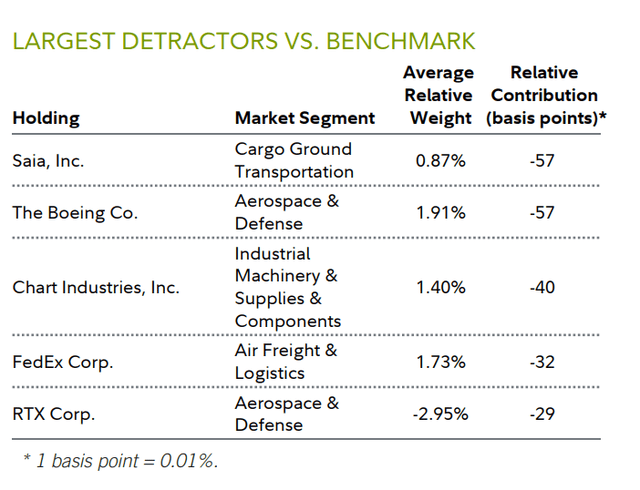
On the negative side, stock picking in cargo ground transportation weighed on the fund’s relative result for the quarter, along with investment choices in aerospace & defense. At the stock level, a large overweight in less-than-truckload hauler Saia (SAIA) (-22%) detracted most on a relative basis. The stock took a spill in July, following revenue and earnings misses for the second quarter. Moreover, in the wake of former competitor Yellow’s bankruptcy in August 2023, Saia has been digesting Yellow’s terminals that it picked up in the auction process. The fund exited the position by quarter-end.
Overweighting Boeing also worked against the fund. The stock price returned about -16% the past three months, sliding considerably in late July, as Q2 financial results for the aerospace giant came up well short of Wall Street’s expectations amid bigger-than-anticipated losses in both its commercial aviation and defense businesses. A strike in September added to the company’s short-term woes.


Outlook and Positioning
Key indicators reflecting the health of U.S. manufacturers continued to reflect weak demand. The ISM Manufacturing PMI recorded a 47.2% mark in September, matching the reading for August. This means that economic activity in the manufacturing part of the U.S. economy contracted for the sixth straight month, and for the 22nd time in the last 23 months. With that said, after such a protracted period of weak readings, we think it makes sense to look for areas of the industrials sector that could be poised for improvement.
While we remain aware of the macro uncertainty that exists as of mid-2024, we like the fund’s exposure to longer-cycle subsectors and companies tied to themes such as the improving aerospace cycle, as well as reshoring, upgrading the power grid and addressing climate change. The portfolio also holds some short-cycle plays geared to potential improvement in U.S. economic activity.
Industrial machinery & supplies & components was the fund’s largest subindustry overweight as of quarter end, given our expectations for improving demand there in a normalizing economy. Several stocks in this group were among the portfolio’s largest individual overweights as of September 30, including Ingersoll Rand (IR), ITT (ITT), Parker-Hannifin (PH), Dover (DOV) and Chart Industries (GTLS).
Cargo ground transportation was another group in which the fund carried a sizable overweight at the end of September, although the overweight was smaller than three months ago. Noteworthy holdings here included Knight-Swift Transportation (KNX). These are short-cycle companies that should be early beneficiaries of an improving economy.
One group we added to this quarter was building products, mainly through a larger position in Fortune Brands Innovations (FBIN). We want to be positioned to benefit from a cyclical improvement in housing turnover, which we’re more likely to see in a rate-cutting environment. We think Fortune fits this industry thesis, as roughly 70% of its portfolio is geared towards the North American repair- and-remodel market. Fortune’s portfolio includes a mix of leading brands in bathroom and plumbing fixtures, doors, composite decking and security products. On top of the potential cyclical recovery, we’re excited about the growth prospects for the firm’s emerging business in connected and leak-detection products.
Aside from human resource & employment services, a segment we avoided completely in favor of other groups where we saw stronger growth potential, noteworthy sub-industry underweights included construction machinery & heavy transportation equipment. The fund’s only holdings in this group were Caterpillar (CAT) and Westinghouse Air Brake Technologies (WAB). We are reluctant to invest more heavily here until we see better economic growth in China, where much incremental demand for this segment comes from.
Perhaps this will occur in the wake of China’s stimulus measures announced in September, but we await further evidence that those measures are having a meaningful impact.
The fund was also significantly underweight industrial conglomerates at quarter end, although this was partly due to General Electric’s departure from that group as a result of its restructuring moves.
The portfolio’s top-three individual overweights as of September 30 were Howmet Aerospace, Ingersoll Rand and ITT. The three largest underweights at quarter end were RTX, Honeywell (HON) and Caterpillar.
As always, we thank you for your confidence in Fidelity’s investment-management capabilities.
|
Before investing in any mutual fund, please carefully consider the investment objectives, risks, charges, and expenses. For this and other information, call or write Fidelity for a free prospectus or, if available, a summary prospectus. Read it carefully before you invest. Past performance is no guarantee of future results.Views expressed are through the end of the period stated and do not necessarily represent the views of Fidelity. Views are subject to change at any time based upon market or other conditions and Fidelity disclaims any responsibility to update such views. These views may not be relied on as investment advice and because investment decisions for a Fidelity fund are based on numerous factors, may not be relied on as an indication of trading intent on behalf of any Fidelity fund. The securities mentioned are not necessarily holdings invested in by the portfolio manager(s) or FMR LLC. References to specific company securities should not be construed as recommendations or investment advice. Diversification does not ensure a profit or guarantee against a loss. S&P 500 is a registered service mark of Standard & Poor’s Financial Services LLC. Other third-party marks appearing herein are the property of their respective owners. All other marks appearing herein are registered or unregistered trademarks or service marks of FMR LLC or an affiliated company. Fidelity Brokerage Services LLC, Member NYSE, SIPC, 900 Salem Street, Smithfield, RI 02917. Fidelity Distributors Company LLC, 500 Salem Street, Smithfield, RI 02917. © 2024 FMR LLC. All rights reserved. Not NCUA or NCUSIF insured. May lose value. No credit union guarantee. 657263.49.0 |
Read the full article here


