The Short Duration Income Fund’s Institutional Class returned +2.66% in the third quarter compared to a +2.96% return for the Bloomberg 1-3 Year U.S. Aggregate Index. Relative results modestly lagged in the quarter while year-to-date and longer-term results (3-, 5-, and 10-year), both absolute and relative, continue to outpace the index.
Overview
The long-awaited Fed cutting cycle is here. On September 18th, the Federal Reserve delivered a decisive 50-basis point cut to the Federal Funds rate. Moreover, by the power of its “dot plot” projections, the Fed expects short-term interest rates to decline an additional 200 basis points over the next two years. Whether this comes to fruition or not is anybody’s guess, but as markets often do, interest rates and credit spreads rallied ahead of the Fed’s anticipated policy moves. This resulted in strong third-quarter returns across fixed income markets, leading to solid year-to-date results, with the highest credit risk categories leading the charge.
 |
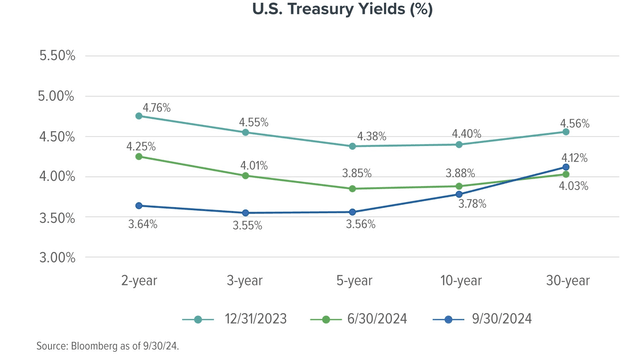
U.S. Treasury interest rates declined meaningfully in the third quarter of 2024, with the largest rate declines in the 2- and 3-year portion of the yield curve as the chart below highlights.
Corporate credit spreads continued to grind tighter in the quarter, resulting in less margin for error should any unwanted economic, geopolitical, and/or market turbulence arise. Broad investment grade credit spreads remain near historic lows. As measured by the ICE BofA, investment grade credit spreads declined from 96 basis points (bps) as of June 30 to 92 bps on September 30. High yield spreads (as measured by the ICE BofA) were even tighter declining from 321 bps as of June 30 to 303 bps as of September 30.
The Short Duration Income Fund’s yield-to-worst (YTW) which represents the worst-case possible annualized return, absent defaults, that a bond or portfolio could earn based on a point-in-time snapshot of market prices, decreased from 5.7% on June 30, to 4.9% on September 30 – but still exceeds, by more than 90 bps, the index’s YTW of 4.0% on September 30. Additionally, the Fund’s favorable YTW position is complimented by a lower interest rate risk exposure relative to the Index, as measured by duration (1.3-year duration for the Fund compared to 1.8-years for the index).
Portfolio Positioning
The table on the next page shows the change in allocation to various sectors, from the prior quarter and from the prior year. This summary provides a view over time of how we have allocated capital. Since our goal is to invest in sectors that we believe offer the best risk-adjusted returns, our allocations may change significantly over time.
|
SECTOR ALLOCATION (% of net assets) |
|||||
|
9/30/2024 |
6/30/2024 |
Qtr Over Qtr Change |
9/30/2023 |
Yr Over Yr Change |
|
|
Corporate Bonds |
7.7 |
9.1 |
-1.4 |
11.2 |
-3.5 |
|
Corporate Convertible Bonds |
0.3 |
1.0 |
-0.7 |
1.1 |
-0.8 |
|
Asset-Backed Securities (ABS) |
37.2 |
38.8 |
-1.6 |
38.5 |
-1.3 |
|
Corporate Collateralized Loan Obligations (CLOs)* |
9.5 |
11.0 |
-1.5 |
13.2 |
-3.7 |
|
Commercial Mortgage-Backed Securities (CMBS) |
6.8 |
6.4 |
+0.4 |
8.8 |
-2.0 |
|
Agency Mortgage-Backed (MBS) |
8.7 |
8.4 |
+0.3 |
3.6 |
+5.1 |
|
Non-Agency Mortgage Backed (RMBS) |
9.7 |
9.7 |
0.0 |
5.9 |
+3.8 |
|
U.S. Treasury |
22.9 |
25.4 |
-2.5 |
29.2 |
-6.3 |
|
Cash & Equivalents |
6.7 |
1.2 |
+5.5 |
1.7 |
+5.0 |
|
TOTAL |
100 |
100.0 |
100 |
||
|
High Yield** |
1.2 |
2.7 |
-1.5 |
3.3 |
-2.1 |
|
Average Effective Duration |
1.3 |
1.5 |
-0.2 |
1.4 |
-0.1 |
|
Average Effective Maturity |
3.4 |
3.6 |
-0.2 |
3.6 |
-0.2 |
*Corporate CLOs are included in the ABS segment in the Fund’s schedule of investments but are additionally called out separately for the purposes of the discussion. **High-Yield exposure (as of 09/30/2024) consists of investments in the Corporate, Corporate Convertible, ABS and CMBS sectors. +Corporate CLOs and CMBS may include private credit investments.
Investment activity remained strong in the third quarter as we sourced nearly $90 million of new investments for the Fund, exceeding the Fund’s quarterly paydowns and maturities of securities (approximately $80 million in the third quarter). By design, the Fund has a distinct feature of having approximately 25%-30% of its holdings paydown or mature in any given year. This allows for frequent reinvestment of investor capital into areas of the fixed-income market that we believe provide the best current relative value opportunities.
Noteworthy investment activity:
- Asset-backed securities (ABS) issued by Pagaya, Wheels, and Greensky, which are backed by consumer, fleet lease, and home improvement loans. Like most of our other ABS investments, these third-quarter investments are short average life (less than 2.5 years), primarily senior securities from recent securitizations.
- Agency and non-agency mortgage-backed securities (MBS) – MBS, both agency and non-agency, continue to present compelling opportunities, relative to corporate credit, to deploy capital in shorter-duration securities. Examples in agency MBS include front sequential CMO’s (Collateralized Mortgage Obligations), meaning they have structural protection regarding prepayment and typically short average lives. We also added to similar front cash flow, short average life opportunities in existing non-agency MBS sponsor Goldman Sachs.
- Commercial real estate collateralized loan obligations (CRE CLOs) issued by Prime Finance. Prime, formed in 2008, is a private commercial real estate finance company, that has originated/acquired and serviced approximately $23.5 Billion of CRE loans since inception. The Fund’s investment is backed by a static pool of fully identified assets (37 collateral interests and 79 mortgaged properties) with no ability to reinvest/recycle capital to add unidentified assets post-closing. The three largest property types are: multifamily (more than 2/3); hotel (8.9%); and office (8.1%). The Fund’s investments consist of the two highest portions of Prime’s 11th CRE CLO securitization where structural protection is highest (in the form of credit enhancement). Base case average life is under two years with extension options that could extend to five years. We view the strength of sponsor, quality of the collateral pool, and spread over SOFR (Secured Overnight Finance Rate) on these floating rate investments represents a good example of favorable risk/adjusted returns we strive to source when looking beyond benchmark segments.
In terms of overall portfolio metrics, from June 30, 2024, to September 30, 2024, the Fund’s average effective maturity declined from 3.6 years to 3.4 years, and its average effective duration declined from 1.5 years to 1.3 years. These measures provide a guide to the Fund’s interest rate sensitivity.
Top Quarterly Contributors
All segments contributed to quarterly performance. Top quarterly contributors included U.S. Treasuries, Agency and non-agency CMOs (Collateralized Mortgage Obligations), ABS (Asset-Backed Securities) backed by auto, equipment, fleet, and consumer loans, and CLOs (Collateralized Loan Obligations – both commercial real estate and middle-market). Year-to-date contributors consisted of the same segments.
Top Quarterly Detractors
No segment detracted from quarterly performance.
Fund Strategy
Our approach consists primarily of investing in a diversified portfolio of high-quality bonds while generally maintaining an overall portfolio average effective duration of 1.0 to 3.5 years. We may invest up to 15% in fixed income securities that are not considered investment-grade (such as high-yield and convertible bonds), and we do so when we perceive the risk/reward characteristics to be favorable.
Like the Fed, we remain ‘data dependent’, but not on the data that captivates the daily news stream. While being cognizant of the daily data noise, we remain resolute and believe our time is better spent on the fundamental work of identifying sectors, securities, and sponsors that we believe will drive future returns for investors. Overall, we strive to be adequately compensated for the risks assumed while seeking to maximize investment (or reinvestment) income and avoid making interest-rate bets, particularly ones that depend on interest rates going down.
Our goals remain the same. Namely ((A)) preserve capital, ((B)) maintain a strong liquidity position, ((C)) understand evolving risks and opportunities, ((D)) conduct consistent/thorough credit surveillance, and ((E)) selectively take advantage of favorable risk/reward opportunities.
We believe our ability to cast a wider net across the fixed income landscape, particularly across securitized products that have meaningful structural enhancements, where higher income relative to indexes is available, remains a meaningful advantage relative to more indexed constrained alternatives.
|
RETURNS(%) |
||||||||||||
|
TOTAL RETURNS QTR YTD |
AVERAGE ANNUAL TOTAL RETURNS Since Inception 1-YR 3-YR 5-YR 10-YR 20-YR 30-YR 35-YR (12/23/1988) |
Net Expense |
Gross Expense |
|||||||||
|
WEFIX Institutional Class |
2.66 |
5.16 |
7.77 |
2.75 |
2.68 |
2.39 |
3.10 |
4.26 |
4.60 |
4.70 |
0.45 |
0.53 |
|
WSHNX Investor Class |
2.61 |
5.07 |
7.66 |
2.65 |
2.59 |
2.24 |
2.99 |
4.19 |
4.53 |
4.63 |
0.65 |
0.95 |
|
Bloomberg U.S. Agg 1-3 YR Index |
2.96 |
4.41 |
7.23 |
1.51 |
1.65 |
1.63 |
2.28 |
3.49 |
n/a |
n/a |
– |
– |
|
YIELDS(%) |
|||
|
30-DAY SEC YIELD Subsidized Unsubsidized |
Distribution Yield |
||
|
WEFIX |
4.83 |
4.69 |
4.65 |
|
WSHNX |
4.63 |
4.42 |
4.54 |
|
This material must be preceded or accompanied by a prospectus or summary prospectus. 30-Day SEC Yield represents net investment income earned by a fund over a 30-day period, expressed as an annual percentage rate based on the Fund’s share price at the end of the 30-day period. Subsidized yield reflects fee waivers and/or expense reimbursements during the period. Without such fee waivers and/or expense reimbursements, if any; yields would have been lower. Unsubsidized yield does not adjust for any fee waivers and/or expense reimbursement in effect. Distribution yield is a measure of yield calculated by taking a fund’s most recent income distribution payment divided by its net asset value (NAV) and expressed as an annual rate. Data is for the quarter ending 09/30/2024. The opinions expressed are those of Weitz Investment Management and are not meant as investment advice or to predict or project the future performance of any investment product. The opinions are current through 10/09/2024, are subject to change at any time based on market and other current conditions, and no forecasts can be guaranteed. This commentary is being provided as a general source of information and is not intended as a recommendation to purchase, sell, or hold any specific security or to engage in any investment strategy. Investment decisions should always be made based on an investor’s specific objectives, financial needs, risk tolerance and time horizon. Data quoted is past performance and current performance may be lower or higher. Past performance is no guarantee of future results. Investment return and principal value of an investment will fluctuate, and shares, when redeemed, may be worth more or less than their original cost. Please visit weitzinvestments.com for the most recent month-end performance. Investment results reflect applicable fees and expenses and assume all distributions are reinvested but do not reflect the deduction of taxes an investor would pay on distributions or share redemptions. Net and Gross Expense Ratios are as of the Fund’s most recent prospectus. Certain Funds have entered into fee waiver and/or expense reimbursement arrangements with the Investment Advisor. In these cases, the Advisor has contractually agreed to waive a portion of the Advisor’s fee and reimburse certain expenses (excluding taxes, interest, brokerage costs, acquired fund fees and expenses and extraordinary expenses) to limit the total annual fund operating expenses of the Class’s average daily net assets through 07/31/2025. The Gross Expense Ratio reflects the total annual operating expenses of the fund before any fee waivers or reimbursements. The Net Expense Ratio reflects the total annual operating expenses of the Fund after taking into account any such fee waiver and/or expense reimbursement. The net expense ratio represents what investors are ultimately charged to be invested in a mutual fund. Short Duration Income Fund’s inception date is 12/28/1988. Performance quoted for Investor Class shares before their inception (08/01/2011) is derived from the historical performance of the Institutional Class shares and has not been adjusted for the expenses of the Investor Class shares, had they, returns would have been different. Effective 12/16/2016, the Fund revised its principal investment strategies. Since that time the Fund has generally maintained an average effective duration between one to three and a half years. Prior to that date, the Fund maintained a dollar-weighted average maturity of between two to five years. Performance prior to 12/16/2016 reflects the Fund’s prior principal investment strategies and may not be indicative of future performance results. Index performance is hypothetical and is shown for illustrative purposes only. You cannot invest directly in an index. The Bloomberg 1-3 Years U.S. Aggregate Index is generally representative of the market for investment grade, U.S. dollar denominated, fixed-rate taxable bonds with maturities from one to three years. The Fund has also selected a broad-based index for regulatory requirements, the Bloomberg U.S. Aggregate Bond Index. This index is a broad-based index that measures the investment grade, U.S. dollar-denominated, fixed-rate taxable bond market. See the Fund’s Prospectus for additional information. Holdings are subject to change and may not be representative of the Fund’s current or future investments. Credit ratings are assigned to underlying securities utilizing ratings from a Nationally Recognized Statistical Rating Organization (NRSRO) such as Moody’s and Fitch, or other rating agencies and applying the following hierarchy: security is determined to be Investment Grade if it has been rated at least BBB- by one credit rating agency; once determined to be Investment Grade (BBB- and above) or Non-Investment Grade (BB+ and below) where multiple ratings are available, the lowest rating is assigned. Mortgage-related securities issued and guaranteed by government-sponsored agencies such as Fannie Mae and Freddie Mac are generally not rated by rating agencies. Securities that are not rated do not necessarily indicate low quality. Ratings are shown in the Fitch scale (e.g., AAA). Ratings and portfolio credit quality may change over time. The Fund itself has not been rated by a credit rating agency. Definitions: Average effective duration provides a measure of a fund’s interest-rate sensitivity. The longer a fund’s duration, the more sensitive the fund is to shifts in interest rates. Average effective maturity is the weighted average of the maturities of a fund’s underlying bonds. Basis point (bps) refers to a unit of measurement that is equal to 1/100th of 1%, or 0.01%. Commercial real estate collateralized loan obligations (CRE CLOs) are a type of asset-backed security backed by a pool of commercial loans. Spreads are measured by ICE BofA which is a group of indexes that track the performance of U.S. dollar-denominated debt issued in the U.S. domestic market. Investment Grade Bonds are those securities rated at least BBB- by one or more credit ratings agencies. Middle market refers to smaller companies, generally with earnings before interest, taxes, and amortization of generally less than $75 million. Non-Investment Grade Bonds are those securities (commonly referred to as “high yield” or “junk” bonds) rated BB+ and below by one or more credit ratings agencies. A Rated Feeder is a type of a traditional feeder fund (an investment fund that collects investor capital and invests it into a master fund) that issues both rated debt and equity. In each case, the equity provides the subordination required to support the ratings of the debt. Yield to worst (YTW) is the lowest potential yield that can be received on a bond portfolio without the underlying issuers defaulting. Credit spread is the difference in yield between two debt instruments with different credit ratings but the same maturity. Consider these risks before investing: All investments involve risks, including possible loss of principal. These risks include market risks, such as political, regulatory, economic, social and health risks (including the risks presented by the spread of infectious diseases). In addition, because the Fund may have a more concentrated portfolio than certain other mutual funds, the performance of each holding in the Fund has a greater impact upon the overall portfolio, which increases risk. See the Fund’s prospectus for a further discussion of risks related to the Fund. Investors should consider carefully the investment objectives, risks, and charges and expenses of a fund before investing. This and other important information is contained in the prospectus and summary prospectus, which may be obtained at weitzinvestments.com or from a financial advisor. Please read the prospectus carefully before investing. Weitz Securities, Inc. is the distributor of the Weitz Funds. |
Original Post
Editor’s Note: The summary bullets for this article were chosen by Seeking Alpha editors.
Read the full article here


