The Kayne Anderson Energy Infrastructure Fund (NYSE:KYN) is a closed-end fund that invests primarily in midstream corporations and master limited partnerships. This is an asset class that may become more appealing over the coming weeks and months as the Federal Reserve is expected to begin lowering interest rates later this month. It is uncertain how far it will reduce interest rates overall, but the market is favoring five 25-basis point cuts by the end of 2024:
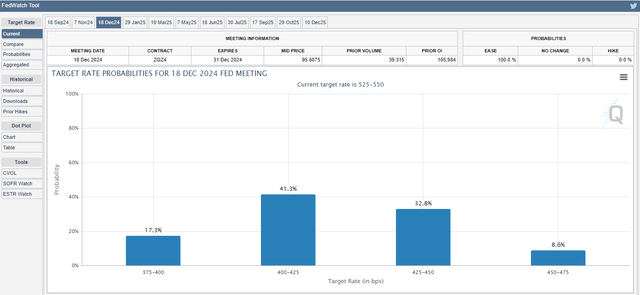
Chicago Mercantile Exchange
Likewise, the market currently expects that short-term interest rates will most likely be 3.50% to 3.75% by the end of 2025:
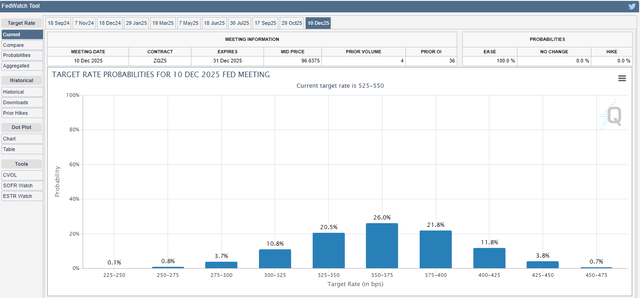
Chicago Mercantile Exchange
While the impact that this will have on long-term interest rates is uncertain, it could still increase the attractiveness of midstream companies and master limited partnerships. This is due to the fact that these companies typically have very high yields. As interest rates decline, the attractiveness of holding cash decreases, and investors become more willing to take on the risks of holding high-yielding common equities. Thus, midstream companies become relatively more attractive in a low-interest rate environment. In such a scenario, we would expect that the market price of midstream companies would increase and that would benefit investors in the Kayne Anderson Energy Infrastructure Fund.
As midstream companies generally have very high yields, we would expect the Kayne Anderson Energy Infrastructure Fund to also have a very high yield. This is indeed the case, as the fund yields 8.11% at the current share price. Here is how that compares to some of the fund’s peers:
|
Fund Name |
Morningstar Classification |
Current Yield |
|
Kayne Anderson Energy Infrastructure Fund |
Equity-MLP |
8.11% |
|
ClearBridge Energy Midstream Opportunity Fund (EMO) |
Equity-MLP |
6.63% |
|
Neuberger Berman Energy Infrastructure and Income Fund (NML) |
Equity-MLP |
8.65% |
|
NXG Cushing Midstream Energy Fund (SRV) |
Equity-MLP |
12.63% |
|
Tortoise Pipeline & Energy Fund (TTP) |
Equity-MLP |
5.64% |
As we can clearly see, the Kayne Anderson Energy Infrastructure Fund is nowhere near the highest-yielding fund in this particular sector. In fact, its yield represents the median of this peer group, as there are two higher-yielding funds and two lower-yielding funds. This may reduce the fund’s appeal to those investors who are seeking to maximize the income that they earn from the assets in their portfolios, but this should not be the case. After all, the fact that the Kayne Anderson Energy Infrastructure Fund only manages to boast the median yield is a sign from the market that it expects the distribution to be sustainable at the current level. That is something that most income-seeking investors can appreciate. After all, one of our biggest goals is to generate a stable income from our investments that we can use to pay our bills or cover other expenses.
As regular readers may remember, we previously discussed the Kayne Anderson Energy Infrastructure Fund in mid-April of 2024. The equity market since that time has generally been fairly strong due both to investors’ exuberance surrounding generative artificial intelligence as well as the expectation of interest rate cuts in the near future. In previous bull cycles, such as the one that lasted from 2010 to 2021, we frequently saw midstream corporations and master limited partnerships left out of the rally. This was not the case this time, however, which might be due to the increased appeal of their high yields during a period of falling interest rates. As such, we might expect the Kayne Anderson Energy Infrastructure Fund to have also delivered a reasonably attractive performance.
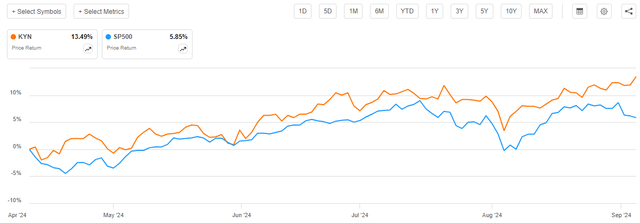
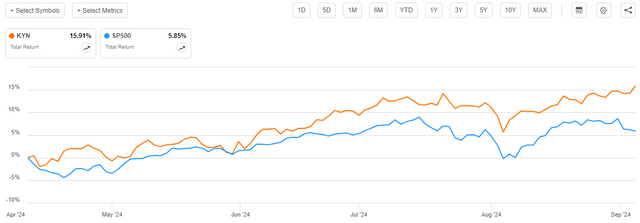
This assumption proves to be correct, as shares of the Kayne Anderson Energy Infrastructure Fund have risen by an impressive 13.49% since our previous discussion:
Seeking Alpha
As we can clearly see, this fund managed to outperform the S&P 500 Index (SP500) by a considerable margin over the roughly five-month period. This is likely to be a big surprise to those investors who have been following the midstream sector for a while, as it has typically been quite rare for midstream companies (or indeed anything in the traditional energy sector) to outperform the S&P 500 Index. Nonetheless, that was the case over the past few months.
In fact, though, investors in this fund have outperformed the S&P 500 Index by even more than the above chart suggests. As I stated in my previous article on this fund:
Closed-end funds such as the Kayne Anderson Energy Infrastructure Fund typically pay out most or all of their investment profits to the shareholders in the form of distributions. The basic goal is for the fund’s assets to remain relatively stable while the shareholders receive all of the profits earned by the portfolio. These distributions include both the dividends and other payments made by the assets in the fund and any capital gains that the fund manages to realize. This is the reason why closed-end funds usually have much higher yields than just about anything else in the market. It also means that shareholders in a fund will normally do much better than the share price performance suggests since the distribution itself is an investment return.
We should, therefore, include the distributions paid by the fund in our performance analysis. When we do that, we get this alternative to the chart above:
Seeking Alpha
The Kayne Anderson Energy Infrastructure Fund only pays a quarterly distribution, so it does not receive as big a boost to the total return over five months as a monthly paying closed-end fund. This is due to the fact that the fund made fewer payments over the period. However, we can still see that investors in this fund beat the S&P 500 Index by more than 10% over a five-month period. That is certainly an impressive performance, and it seems likely to appeal to any investor, regardless of their overall goals. After all, we all like to beat the market, and this fund has certainly managed to accomplish that recently.
As approximately five months have passed since we last discussed the Kayne Anderson Energy Infrastructure Fund, it is likely that many things have changed. The remainder of this article will focus specifically on these changes, as well as provide an update on the fund’s distribution coverage and overall financial performance.
About The Fund
According to the fund’s website, the Kayne Anderson Energy Infrastructure Fund has the primary objective of providing its investors with a very high level of total return. This makes sense for an equity fund because common equities are a total return vehicle. After all, investors purchase common equities because they are hoping to receive both current income (via dividends and distributions paid by common equities) and capital gains. That is the very definition of total return.
The website makes it clear that the fund is an equity fund, as it states:
[The Fund’s investment objective is] to provide a high after-tax total return with an emphasis on making cash distributions to stockholders. KYN intends to achieve this objective by investing at least 80% of its total assets in securities of energy infrastructure companies.
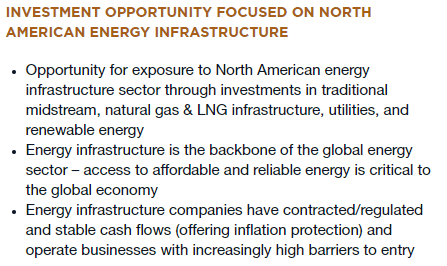
The website does not exactly define what the fund considers to be an “energy infrastructure company,”, however it makes the following statements about this:
Kayne Anderson
The first bullet point provides a small amount of insight, as it says that the fund’s investments might include midstream companies, liquefied natural gas producers, utilities, and renewable energy producers. It also says that the companies that it invests in will typically have relatively stable cash flows and high barriers to entry. However, this last bullet point does not completely apply to renewable energy producers.
As subscribers to Energy Profits in Dividends are well aware, renewable energy companies have been suffering over the past few years due to a lack of profitability. On Tuesday, September 3, 2024, solar power producer Lumio filed for Chapter 11 bankruptcy protection due to severe liquidity problems. An article posted to Zero Hedge included some quotes from one of Lumio’s board members that are rather descriptive of the situation:
In a court declaration, Jeffrey T. Varsalone, a Lumio board member, said the company has faced a “severe liquidity crisis” over the past year, which he attributed to “a sharp decline in demand in the solar market and various macroeconomic headwinds.
Varsalone blamed increases in inflation and a subsequent jump in interest rates to have resulted in “reduced demand across the entire solar power industry,” thus negatively impacting Lumio’s financial performance.”
More than 100 solar power companies have filed for bankruptcy protection year-to-date, with most of them making similar claims as Lumio. This is certainly not something that we would expect to see in an industry with stable cash flows, as the fund’s website claims. Renewable energy companies have been struggling to survive in a high-interest rate environment, despite the fact that they receive enormous subsidies from most developed-market governments.
Meanwhile, traditional midstream companies have not been particularly impacted by interest rates. For example, let us take a look at the interest expenses paid by MPLX (MPLX), which is currently the largest holding in the Kayne Anderson Energy Infrastructure Fund. Here are the company’s quarterly total and net interest expenses going back the whole way to the fourth quarter of 2021:

Seeking Alpha
(all figures in millions of U.S. dollars)
In the fourth quarter of 2021, the federal funds rate was at 0%, although long-term interest rates were beginning to rise as the inflation present in the market during that year led the market to expect that the Federal Reserve would soon increase its benchmark rate. For our purposes today, we can see that MPLX paid $199.0 million in net interest back in the fourth quarter of 2021. That figure increased to $220.0 million in the second quarter of 2024, which represents a 10.55% increase over the period in question.
This 10.55% increase in net interest did not strain MPLX’s cash flow or liquidity at all. We can see this quite clearly here:
|
Q2 2024 |
Q4 2021 |
|
|
Adjusted EBITDA |
$1.653 |
$1.445 |
|
Distributable Cash Flow |
$1.404 |
$1.207 |
(all figures in billions of U.S. dollars)
Distributable cash flow is after the company pays both taxes and interest on its debt. As we can clearly see, the company managed to post an increase in this figure over the period in question despite the fact that its interest expenses went up. We see the same thing with just about any traditional midstream company.
Thus, we have a situation in which most traditional midstream companies fit with the fund’s statement that the companies that it includes in its portfolio have stable cash flows over time. However, most renewable companies do not satisfy this requirement.
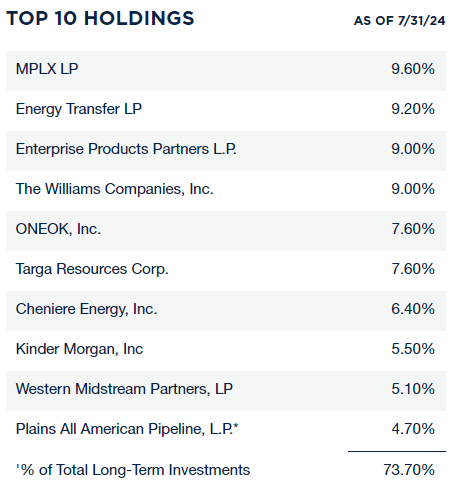
The fund seems to be much more committed to its promise to invest in companies with stable cash flows than its statement about including renewable energy in the portfolio. Nine of the ten largest holdings in the fund’s portfolio as of July 31, 2024, were midstream companies:
Kayne Anderson
The only one of these companies that is not a midstream company is Cheniere Energy (LNG), but that company is frequently included in energy infrastructure funds. Cheniere Energy primarily sells its products and generates revenue based on the terms of long-term contracts that require its customers to buy a specific amount of liquefied natural gas at a set price. However, this has not exactly resulted in the company enjoying stable cash flows. For example, here are Cheniere Energy’s operating cash flows for each of the past eleven twelve-month periods:

Seeking Alpha
(all figures in millions of U.S. dollars)
We can see that Cheniere Energy’s operating cash bounds were range-bound over the period, but it was a fairly big range. The company’s operating cash flows varied from $2.469 billion to $11.289 billion during any given twelve-month period, which is not what most people would consider to be stable.
It is true that Cheniere Energy’s costs will vary over time due to its business model. The company operates somewhat like a refinery, as it purchases natural gas and converts it to liquefied natural gas for sale. As such, we can expect both its revenue and the cost of goods sold to vary with natural gas prices. However, the company’s gross profit (defined as revenue minus the cost of the natural gas that it buys) has varied considerably from period to period:

Seeking Alpha
(all figures in millions of U.S. dollars)
While earlier years shown in this chart can be ignored somewhat due to the company’s production increasing in 2022 when a sixth liquefaction train came online at its Sabine Pass facility, rendering some of the earlier periods not completely comparable to later ones, we can still see that the company’s gross profit tended to exhibit considerable variation. Thus, Cheniere Energy arguably might not completely fit the definition of possessing stable cash flows either, but this is just one company that represents 6.40% of the portfolio. It alone is not weighted high enough to change the fact that the fund seems to favor investing in companies with very stable cash flow generation.
There have been no major changes to the fund’s largest positions list. All ten of the companies shown on the list are the same as were there when we last discussed this fund five months ago. The weightings that are assigned to each of the companies have changed, however. That is to be expected though simply because each of these stocks had a somewhat different performance in the market.
However, the fund’s semi-annual report states that the Kayne Anderson Energy Infrastructure Fund had a 39.4% turnover during the six-month period that ended on May 31, 2024. This works out to 78.8% annualized, which suggests that this fund does a significant amount of trading. We can see further evidence of the fund’s significant trading activity by looking at the turnover ratios that it had in prior years:
|
FY 2023 |
FY 2022 |
FY 2021 |
FY 2020 |
FY 2019 |
|
|
Portfolio Turnover |
48.8% |
28.2% |
50.8% |
22.3% |
22.0% |
This forces us to draw the conclusion that at least some of the weighting changes that we observe in the fund’s largest positions list were intentional on the part of the fund’s management team. In short, the fund sold some of the shares or units that it held in one company and used the proceeds to purchase common equity in another company. This is exactly what we all do when we rebalance our personal portfolios.
Leverage
As is the case with most closed-end funds, the Kayne Anderson Energy Infrastructure Fund employs leverage as a method of boosting the effective yield and total return that it earns from the assets in its portfolio. I explained how this works in my previous article on this fund:
Basically, the fund borrows money and then uses that borrowed money to purchase partnership units of midstream companies. As long as the purchased assets have a higher yield than the interest rate that the fund has to pay on the borrowed money, the strategy works pretty well to boost the effective yield of the portfolio. As this fund is capable of borrowing at institutional rates, which are considerably lower than retail rates, this will usually be the case.
However, the use of debt in this fashion is a double-edged sword. This is because leverage boosts both gains and losses. As a result of this, we want to ensure that the fund is not employing too much leverage since that would expose us to too much risk. I generally do not like to see a fund’s leverage exceed a third as a percentage of its assets for this reason.
As of the time of writing, the Kayne Anderson Energy Infrastructure Fund has leveraged assets comprising 22.83% of its overall portfolio. This represents a fairly significant decline from the 23.81% leverage that we had the last time that we discussed this fund, which is not exactly surprising. After all, the fund’s share price increased fairly dramatically since our last discussion, and usually that correlates to a decline in a fund’s leverage.
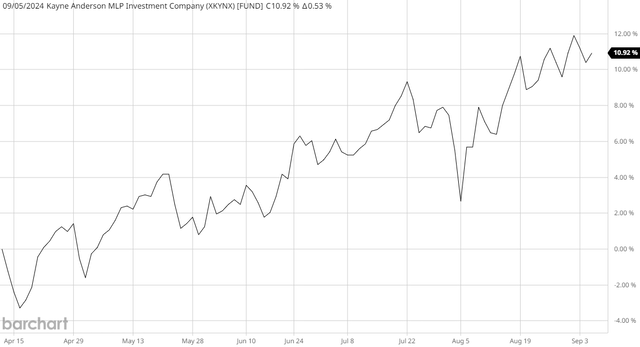
However, it is the net asset value movements that determine the effect on leverage, not the share price. After all, leverage is a percentage of the portfolio itself and the size of the portfolio might not be the same as the fund’s market capitalization. In the case of the Kayne Anderson Energy Infrastructure Fund, we can see that its portfolio increased in size over the period:
Barchart
As we can clearly see, the fund’s net asset value has increased by 10.92% since the time of our last discussion. All else being equal, this causes the fund’s leverage to decline, since leverage is a proportion of the outstanding debt to the total size of the portfolio. This appears to be the case here, but admittedly, we might expect leverage to have declined a bit more than it did, given the substantial increase in the fund’s net asset value.
As was the case the last time that we discussed this fund, the leverage of the Kayne Anderson Energy Infrastructure Fund is substantially below the one-third maximum that we typically consider to be acceptable. However, that one-third level is just a generalized figure and may not be an acceptable ratio given the fund’s strategy. We should compare its leverage to its peers to determine whether or not the fund is using an appropriate amount of leverage. This is summarized in this chart:
|
Fund Name |
Leverage Ratio |
|
Kayne Anderson Energy Infrastructure Fund |
22.83% |
|
ClearBridge Energy Midstream Opportunity Fund |
29.34% |
|
Neuberger Berman Energy Infrastructure and Income Fund |
17.07% |
|
NXG Cushing Midstream Energy Fund |
29.23% |
|
Tortoise Pipeline and Energy Fund |
15.50% |
(all figures from CEF Data)
As was the case with the fund’s distribution yield, the Kayne Anderson Energy Infrastructure Fund represents the median level of leverage out of this peer group. This is an overall positive sign, as it suggests that the fund is using an appropriate amount of leverage for its investment strategy. Overall, we should not need to worry much about its debt level.
Distribution Analysis
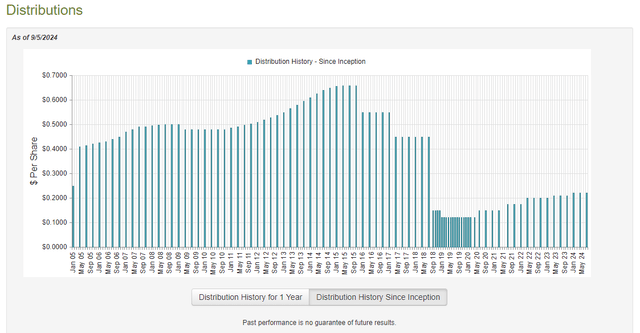
The primary objective of the Kayne Anderson Energy Infrastructure Fund is to provide its investors with a very high level of total return. However, the website states that the fund intends to provide its total return primarily through direct payments to its investors, and it does follow through on this intent. The Kayne Anderson Energy Infrastructure Fund currently pays a quarterly distribution of $0.22 per share ($0.88 per share annually). This gives the fund an 8.11% yield at the current share price, which is reasonable.
Unfortunately, the fund has not been especially reliable with respect to its distributions over the years:
CEF Connect
From the previous article:
As we can see, the fund’s distribution has varied considerably over the years, although the long-term trend has been down. The fund has at least been trying to raise its distribution since 2020. This is not especially surprising, as most midstream funds ended up having to cut their distributions in either 2015 or 2020 as the midstream energy industry in general encountered crisis conditions following a fallout in crude oil prices. The market was generally unwilling to finance these companies and so many of them were forced to cut their distributions and restructure their operations in order to survive. That caused the fund to suffer fairly substantial losses, and it was forced to reduce its own payout in order to preserve its net asset value.
The fact that the fund has been raising its distribution since 2020 is likely going to appeal to those investors who are seeking a safe and secure source of income, although some conservative investors might not be able to excuse the fund’s past. Overall, though, the midstream energy industry is stronger today than it has been in recent memory, and this should provide a certain level of confidence. We should still investigate the fund’s finances and distribution sustainability, however.
The most recent financial report that is available for the Kayne Anderson Energy Infrastructure Fund is the semi-annual report for the six-month period that ended on May 31, 2024. A link to this report was provided earlier in this article. This is a much newer report than the one that was available the last time that we discussed this fund, which is quite nice as it should work as an update.
For the six-month period that ended on May 31, 2024, the Kayne Anderson Energy Infrastructure Fund received dividends and distributions of $40.028 million and surprisingly nothing in interest. However, some of this money came from master limited partnerships and so it is not considered to be investment income for tax or accounting purposes (it is a return of capital). We subtract the partnership distributions from the total to arrive at a total investment income of $22.846 million for the six-month period. The fund paid its expenses out of this amount, which left it with $5.676 million available to its shareholders. That was not sufficient to cover the $74.415 million that the fund paid out in distributions during the period.
The Kayne Anderson Energy Infrastructure Fund was able to make up the difference through capital gains. For the six-month period that ended on May 31, 2024, the fund reported net realized gains of $80.886 million along with $170.550 million of net unrealized capital gains. Overall, the fund’s net assets increased by $186.224 million after accounting for all gains and losses during the period. Thus, the fund easily managed to cover its distributions with a substantial amount of money left over.
Thus, it does not appear that shareholders need to worry too much about potential distribution troubles here. The fund was able to fully cover its distributions solely with net investment income and net realized gains, so even if the market corrects and causes the fund to lose some of its unrealized gains, it should still be okay.
Valuation
Shares of the Kayne Anderson Energy Infrastructure Fund are currently trading at a 13.93% discount on net asset value. This is not as attractive as the 14.76% discount that the fund’s shares have had on average over the past month. However, it is still a double-digit discount so the fund’s current price appears to be reasonable.
Conclusion
In conclusion, the Kayne Anderson Energy Infrastructure Fund is a reasonably attractive way to add some exposure to energy infrastructure companies to your portfolio. Many of these companies have very high distribution yields that will only become more attractive as the Federal Reserve embarks on its upcoming monetary easing cycle. This might be one reason why master limited partnerships and midstream corporations have outperformed the broader large-cap index year-to-date, despite energy prices remaining relatively stable. This outperformance is reflected in the performance of this fund, which has also beaten the broader large-cap index. The fund also boasts a very attractive distribution yield that is quite well-covered. Indeed, if the second half of the fund’s fiscal year ends up being as good as the first half, it is conceivable that we might see a distribution increase in the near future. That may or may not be the case, though, and investors should not expect a distribution increase when buying the fund today.
The fact that this fund also has a very attractive valuation is another bonus. Overall, there is a lot to like here.
Editor’s Note: This article discusses one or more securities that do not trade on a major U.S. exchange. Please be aware of the risks associated with these stocks.
Read the full article here


