Income investing is an attractive investing strategy, but the majority of stocks have relatively low dividend yields. Or, a desired income would require more capital than we own to achieve using ordinary stocks. The BDC sector comes to mind as a way to spike our portfolio dividend yield and still keep equity-like returns. The subject of this article is the BDC called Capital Southwest (NASDAQ:CSWC).
A BDC is a managed portfolio of loans, with returns amplified with leverage. This simple statement implies that BDCs are analogous to banks. However, unlike banks, they are required by law to pay out at least 90% of their taxable income to avoid corporate taxation. This means that BDCs, unlike banks, are very limited in their ability to retain earnings. These facts motivate the 6 key areas that need to be understood before buying a BDC stock. I will analyze CSWC in these areas:
- Management expense alignment with shareholders
- Leverage, as measured by debt to equity ratios
- Cost of leverage – the lower, the better
- Proportion of assets that are senior secured & floating rate
- Credit quality – what I call the equity appreciation / depreciation rate
- Diversification and concentration in non-cyclical industries
Management Expenses
CSWC is an internally managed BDC. This means that it only has to pay for salaries, share-based compensation, professional fees, and general & administrative expenses. It does NOT charge the fees typically seen in an externally managed BDC: the base management fee computed as a flat 1-1.5% of total assets, and the incentive fee that is computed based on the yield of the asset portfolio. At an externally managed BDC, these fees can represent about 1/4 of the returns of the asset portfolio.
CWSC passes the savings on directly to the shareholder, so in that respect it is similar to MAIN. This is part of the reason why CSWC trades at a large premium as compared to its NAV. (The other part of the reason is that its asset portfolio simply yields more).
Balance Sheet Leverage
Leverage amplifies gains and losses, and BDCs use leverage to boost their returns. The typical BDC has a debt to equity ratio of 0.9-1.25. Let’s take a look at CSWC’s leverage, all figures in millions $USD:
| FY year-end March 31 | Total Liabilities | Total Equity | Debt to Equity |
| 2024 | $801.1 | $775.7 | 1.033 |
| 2023 | $667.3 | $590.4 | 1.130 |
| 2022 | $553.1 | $420.9 | 1.314 |
| 2021 | $399.3 | $336.3 | 1.187 |
| 2020 | $313.3 | $272.2 | 1.151 |
| 2019 | $225.9 | $326.0 | 0.693 |
| 2018 | $109.2 | $308.3 | 0.354 |
| 2017 | $40.7 | $285.1 | 0.143 |
| 2016 | $11.9 | $272.6 | 0.044 |
CSWC’s business model changed in the last few years. Before 2016, it was essentially a holding company for a very successful equity investment, hence very few liabilities on the books. It took until 2020 for CSWC to leverage up to the typical standard for a BDC, a debt to equity ratio of 0.9-1.25. Aside from a blip in 2022, leverage remained stable at about 1.
Asset Portfolio Seniority & Rate Structures
| Asset Type | Fair Value (millions USD), March 31, 2024 |
| First Lien Loans | $1,309 |
| Second Lien Loans | $34 |
| Subordinated Debt | $1 |
| Preferred & Common Equity | $132 |
| Total | $1,477 |
The vast majority of assets at CSWC are first lien, or senior secured loans. This means almost all of the asset portfolio is formally the most conservative type. Additionally, quoting the 2024 10-K:
As of March 31, 2024 and March 31, 2023, approximately $1,310.0 million, or 97.4%, and $1,002.9 million, or 96.7%, respectively, of our debt investment portfolio (at fair value) bore interest at floating rates, of which 96.5% and 100.0%, respectively, were subject to contractual minimum interest rates.
Almost all of the debt portfolio is floating rate. This is good, as floating rate debt has less value volatility in respect with interest rate fluctuations.
Credit Quality & Underwriting Results
I like to use what I call the equity appreciation / depreciation ratio, computed as Net Realized And Unrealized Gains divided by Total Equity, as a quick and dirty way to assess the quality of underwriting at a BDC.
| Year Ended March 31 |
Net Realized And Unrealized Gains (Losses), millions $USD |
Total Equity, millions $USD | Equity Appreciation / Depreciation Ratio | NAV Per Share |
| 2024 | ($26) | $756 | (3.439%) | $16.77 |
| 2023 | ($35) | $590 | (5.932%) | $16.37 |
| 2022 | $11 | $421 | 2.613% | $16.86 |
| 2021 | $29 | $336 | 8.631% | $16.01 |
| 2020 | ($51) | $272 | (18.75%) | $15.13 |
| 2019 | $9 | $326 | 2.761% | $18.62 |
| 2018 | $23 | $308 | 7.468% | $19.08 |
| 2017 | $16 | $285 | 5.614% | $17.80 |
| 2016 | $5 | $273 | 1.832% | $17.34 |
There are two things worth noting here. Firstly, CSWC’s balance sheet was scarred by the COVID crisis in 2020. NAV per share fell from $18.62 to $15.13, and only recovered to the ~$16 range. This means that CSWC suffered a permanent loss due to the 2020 COVID crisis: not typical of BDCs in general. So something is a little fishy about their portfolio to me.
Secondly, CSWC has been growing recently by issuing equity at a premium to its NAV. This means that each equity issuance is accretive to NAV. This explains why even though 2023 and 2024 saw some painful losses in its loan portfolio, it was able to maintain its NAV per share in the $16 range.
With the exception of the COVID crisis, I would generally say that CSWC is capable of protecting its NAV via its underwriting standards.
Cost Of Leverage
Whatever CSWC doesn’t pay in interest, goes right to the shareholder in dividends. As prospective shareholders, we root for a BDC to have as low a cost of liabilities as possible, calculated by dividing interest expense by total liabilities. Figures are in millions $USD for the table below, for CSWC.
| Fiscal Year Ended March 31 | Interest Expense | Total Liabilities | Cost Of Liabilities | Average AAA Bond Yield (FRED) |
| 2024 | $43.1 | $801.1 | 5.38% | 4.81% |
| 2023 | $28.9 | $667.3 | 4.33% | 4.07% |
| 2022 | $19.9 | $553.1 | 3.60% | 2.70% |
| 2021 | $17.9 | $399.3 | 4.48% | 2.48% |
| 2020 | $15.8 | $313.3 | 5.04% | 3.39% |
| 2019 | $12.1 | $225.9 | 5.36% | 3.93% |
| 2018 | $4.9 | $109.2 | 4.48% | 3.74% |
| 2017 | $1.0 | $40.7 | 2.46% | 3.67% |
| 2016 | $0 | $11.9 | 0% | 3.89% |
Overall, CSWC’s liabilities cost slightly more than the average AAA corporate bond yield. This is not as low as cost of leverage can go: ARCC has a cost of leverage slightly lower than the AAA corporate bond yield.
Portfolio Diversification By Industry
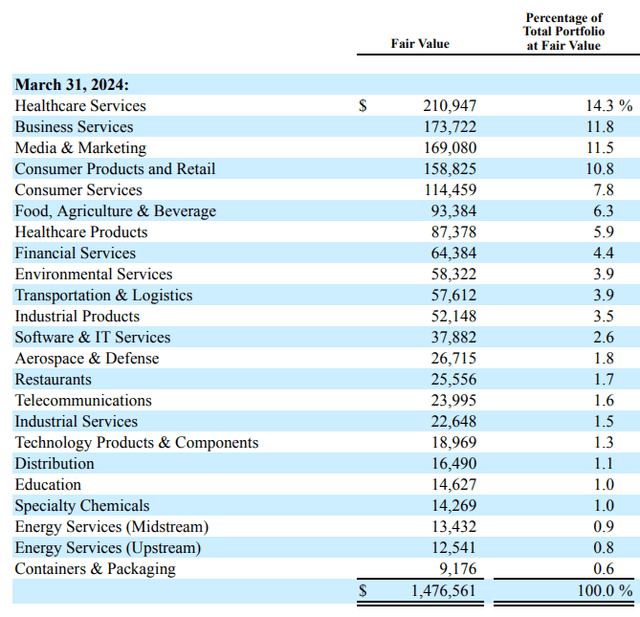
As prospective investors we want to see that the asset portfolio is well diversified across industries, and strongly tilted away from cyclical sectors. The experience of 2014-2015 during the oil price crash, caused by overproduction of shale oil, informs analyzing this aspect of a BDC – during that time BDCs with concentrations in oil & gas industries suffered. The table below is extracted from the 2024 10-K for CSWC:
CSWC 2024 10-K Filing
As we can see, energy is just 1.7% of the asset portfolio by fair value. The portfolio is almost entirely in non-cyclical industries, which earns CSWC a check mark from me.
Current Market Valuation
Let’s compare the price to book ratios and dividend yields (including supplemental dividends) of an externally managed BDC (ARCC), and four internally managed BDCs (CSWC), (MAIN), (HTGC), (TRIN).
| Security | P/NAV | FWD Dividend Yield |
| ARCC | 1.090 | 9.11% |
| CSWC | 1.602 | 9.39% |
| MAIN | 1.717 | 7.48% |
| HTGC | 1.834 | 9.01% |
| TRIN | 1.115 | 14.13% |
CSWC belongs to the same pack as MAIN and HTGC, which are all well-run internally managed BDCs.
Conclusions
Let’s face it, CSWC is a richly valued BDC, but it is richly valued for good reason, as I’ve explained here. It does not charge a management fee or incentive fee typical of externally managed BDCs. It has a decent track record of underwriting, and its cost of leverage is marginally higher than the AAA corporate bond yield. At 1.602x NAV, I believe CSWC is fairly valued, which is why I call it a “hold”.
Read the full article here


