Written by Nick Ackerman, co-produced by Stanford Chemist.
Nuveen Select Tax-Free Income Portfolio (NYSE:NXP) is a closed-end fund providing investors exposure to municipal bonds. It’s also a non-leveraged muni CEF, which has helped make it one of the best performing in this space over the long term. According to CEFData, it is ranked 6th out of 47 for the last 10-year annualized performance.
NXP Muni Peer Rank (CEFData)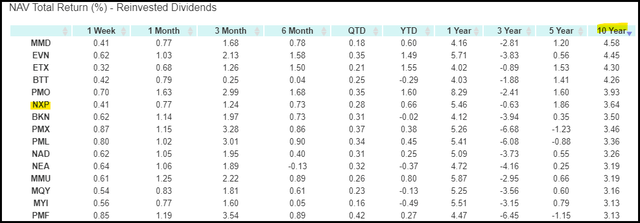
As rates increased materially, all fixed-income funds took a hit and muni bonds, being particularly interest rate sensitive, took even larger hits. NXP wasn’t able to escape those declines, but being that those declines weren’t amplified with leverage, it held up relatively better. To be fair, the first 5 funds that rank higher than NXP above are all leveraged funds. So, some fund sponsors were still able to manage leverage more successfully than others.
Since our last update, the fund has been able to put up quite strong returns. This was thanks to covering the fund later last year when risk-free rates had driven interest rate-sensitive investments meaningfully lower. We covered this fund along with the Nuveen AMT-Free Municipal Fund (NUW) as that recovery was starting to take hold. Further, the fund’s slight discount going to a slight premium now also helped contribute to a strong total share price return during this period.
Ycharts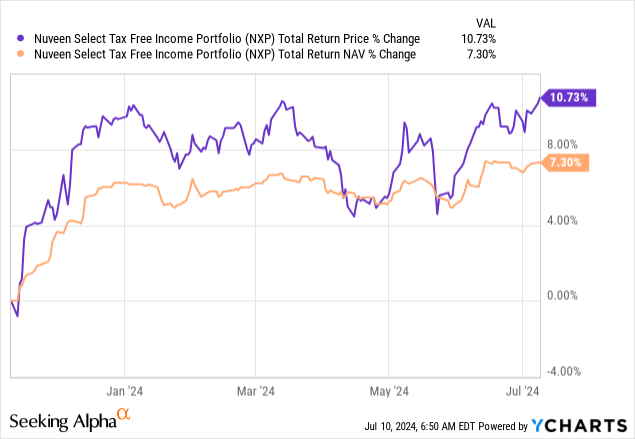
A slight premium is not unusual for NXP, and an investor looking for tax-free income could still view this fund as having some appeal.
NXP Basics
- 1-Year Z-score: 0.83
- Discount/Premium: 0.14%
- Distribution Yield: 4.28%
- Expense Ratio: 0.23%
- Leverage: 0.00%
- Managed Assets: $688.25 million
- Structure: Perpetual
NXP’s investment objective is “current income exempt from regular federal income tax, consistent with preservation of capital.” In attempting to achieve this, the fund will:
Invest at least 80% of its managed assets in municipal securities rated investment grade at the time of investment, or, if they are unrated, are judged by the manager to be of comparable quality. The Fund may invest up to 20% of its managed assets in municipal securities rated below investment quality or judged by the manager to be of comparable quality, of which up to 10% of its managed assets may be rated below B-/B3 or of comparable quality. The Fund may invest in inverse floating rate municipal securities, also known as tender option bonds. The Fund’s use of tender option bonds to more efficiently implement its investment strategy may create up to 10% effective leverage.
NXP does allow for the potential of up to 10% effective leverage, but that’s a very negligible amount. They also rarely dip into utilizing any leverage at all; in fact, for the last five years, their annual report shows that there were no interest expenses paid at all, suggesting none has been used during at least this period.
NXP Leverage Stats (Nuveen)
The expense ratio here is quite low, thanks to a reasonable management fee. That’s generally unheard of in the CEF space, but there are several of the non-leveraged Nuveen muni funds that also share similarly reasonable expense ratios.
Leveraged Peer Comparison
As noted at the opening of this piece, NXP wasn’t able to escape the declines that the muni bond space faced when rates were rising rapidly. However, relative to its leveraged peers, we can see that NXP fared much better.
Ycharts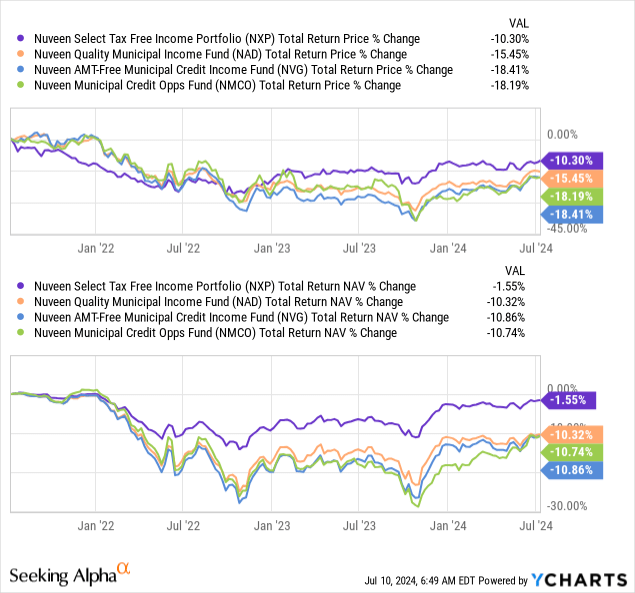
That’s part of what has helped now make the long term picture in terms of total returns favor NXP over these leveraged peers. For this comparison, I wanted to look back at the last ten years, so I removed the Nuveen Municipal Credit Opportunities Fund (NMCO) as it only launched in 2019.
Ycharts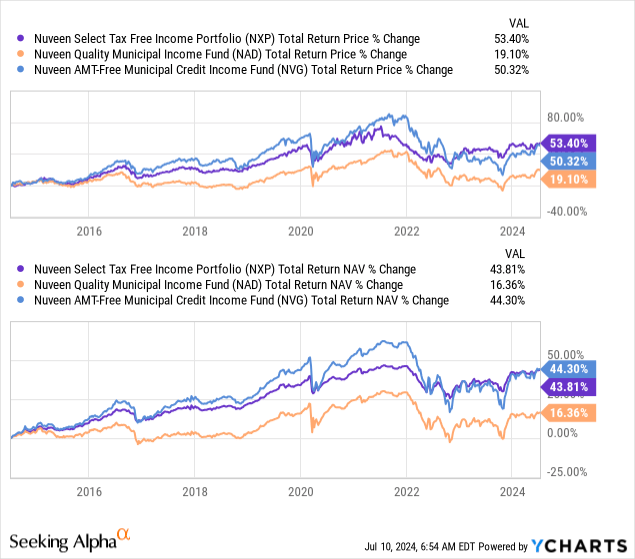
Interestingly, we can see that the Nuveen AMT-Free Municipal Credit Income Fund (NVG) has performed nearly identically on a total NAV return basis over the last decade. The significant underperformed here was the Nuveen Quality Municipal Income Fund (NAD).
It is also worth considering that NXP trades at a slight premium while the other funds here trade at significant discounts. NXP is no stranger to trading at a premium, but it also isn’t a stranger to seeing ~5% discounts at times, either.
Ycharts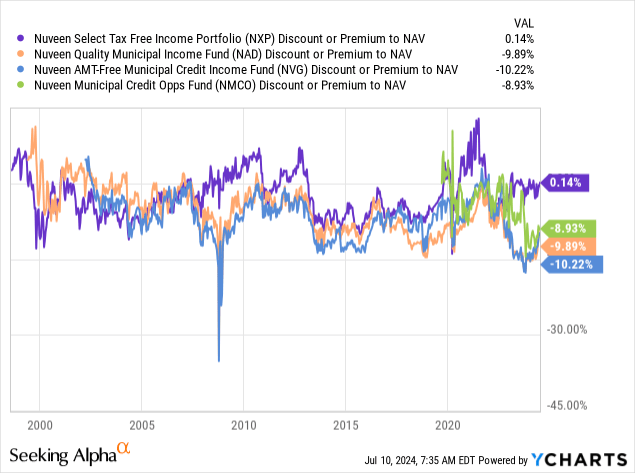
Leverage And Distribution Coverage Comparison
Above, we could observe that prior to risk-free rates and the Fed aggressively raising their target short-term rate, NVG was outperforming quite meaningfully. That isn’t all that unexpected during a time when rates were at zero, so leverage costs were not really a consideration.
Today, with rates where they are, leverage costs are often exceeding what the actual underlying muni bonds are yielding. As an example, NVG last reported annualized leverage costs of 4.71% with an average portfolio coupon of 3.63%. When considering the fund’s operating expenses also come to 1.08%, that makes the negative spread even worse. These leveraged muni funds did not hedge with interest rate swaps or by going short future contracts as some leveraged CEFs had.
When looking at coverage of NVG’s distribution, they may have ramped up the payout significantly recently in order to attempt to close the fund’s discount but that simply destroyed distribution coverage. Average earnings come in at $0.04, with the payout at $0.079, resulting in distribution coverage of 50.63%. The 69.65% listed below is incorrect because that’s still using the previous $0.0575 distribution.
NVG Distribution Stats (Nuveen)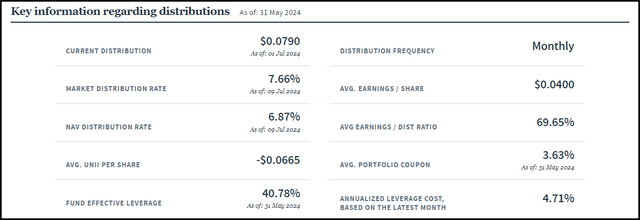
When considering that, NVG’s 7.66% distribution rate may as well be cut in half because that’s what the fund is actually earning. Now, to be fair, they hold a number of zero-coupon positions that will see significant appreciation as they list the average bond price as a percentage of par at $82.50. When excluding the zero-coupon bonds, it goes up to $95.38, which still represents a discount.
NXP also lifted its distribution recently. They now pay a more modest 4.28% distribution rate. Depending on one’s tax bracket, the taxable equivalent yield will be higher.
Naturally, coverage here is going to look much better as they aren’t fighting the costs of leverage, and they are paying a more realistic yield. Based on the average earnings of $0.0505 against the now $0.052 distribution, we would see coverage at 97.11%. Again, the average earnings listed below of 104.2% actually reflect the previous distribution amount, and they haven’t updated it yet.
NXP Distribution Stats (Nuveen)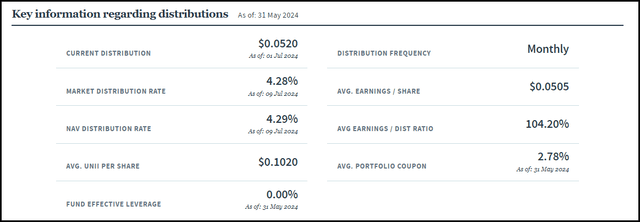
Similar to NVG, NXP also invests in some zero-coupon bonds. The average coupon, not including coupon bonds, comes to 4.95%, or 2.78%, when including the zero-coupon bonds. The average bond price as a percentage of par for NXP comes to $86.26. However, when including not including zero-coupon bonds, the actual average bond price comes to a slight premium of $100.96. It isn’t uncommon for munis to trade above par.
So, in the end, NVG may be able to show a higher distribution rate, but NXP is actually yielding more. For NVG, one should expect return of capital, the destructive kind. Therefore, one isn’t really getting that high of a tax-free rate because only half of it will really be tax-free. The other is more appropriate to label as tax-deferred but also likely never to have to be paid because it should actually see the fund erode over time.
ROC lowers the cost basis of an investment rather than being paid in the year received, that’s why it is more properly described as tax-deferred. However, if the fund’s NAV declines and the share price goes along with it, you might be in a scenario where it is pseudo-tax-free because even after adjusting your basis lower, it still might not result in capital gains.
Rate Cuts To Save The Day? Maybe…
Of course, the next move by the Fed is likely to be a rate cut. That can change the dynamics moving forward relative to what the last few years actually looked like. The problem is that with the latest expectations of only a few rate cuts over the next year or so, leveraged muni funds could still be facing pressures.
Let’s say we get 4 rate cuts over the next year; then, the leverage costs for NVG are still likely to only drop just below 4% with just over 1% on top of that of operating expenses. The negative spread is reduced, but we’d need to see at least 200 basis points of cuts before it is really a positive contributor rather than just less of a negative drag.
That said, there is another glimmer of hope because the underlying portfolio will get the added benefit of meaningfully higher potential appreciation. This comes from being more interest rate sensitive based on employing leverage. NXP’s average effective duration comes to 7.57 years. So, all else being equal, should rates fall by 1%, NXP’s portfolio should rise by 7.57%.
NVG has an average leveraged-adjusted effective duration of 14.73 years—meaning for every 1% decline in interest rates, we’d see the underlying should rise 14.73%. That’s considerable and could be why the management team felt like increasing the distribution rates so significantly would be fine in the end.
Of course, Karpus Management, an activist group, going after several of Nuveen’s muni funds also put pressure on Nuveen to do something to try to reduce the discounts we see in the leverage funds. Saba Capital Management was also targeting some of Nuveen’s peers and their muni CEFs, so that likely played a role in some of their decisions as well.
With all that said, NXP is not in this situation of needing rate cuts to perform. They can mostly cover their current distribution through income generated in the portfolio. Any rate cuts will just be potentially capital appreciation gravy.
Conclusion
NXP is a non-leveraged closed-end fund focused on providing tax-free income to its investors through investing in a diversified pool of municipal bonds. They recently raised their monthly distribution, but it was to a reasonable level where coverage remains relatively strong. They might not be in a position to benefit as significantly from rate cuts as some of their peers, but they also didn’t experience a lot of the damage that those peers had either. That puts them in a situation where they don’t have to dig themselves out of as large of a hole and a situation where they don’t need significant rate cuts to perform well and cover their payout.
Read the full article here


