Investment Thesis: I rate the stock as a Hold at this time.
Commercial Metals Company (NYSE:CMC) is best known as being the largest manufacturer of steel reinforcing bar in North America and Central Europe, and also produces merchant bar, steel fence post and wire rod. The company is a supplier for major construction projects across two continents.
The stock has seen growth of just over 11% from that of the previous year.
TradingView.com
The purpose of this article is to assess whether the stock has the capacity for further growth from here.
Performance
When looking at performance for the most recent quarter (as released on June 20, 2024), we can see that net sales and earnings are down on that of the prior year quarter, with net sales down by 11% on a three months ended basis and diluted earnings per share down by 48% over the same period.
CMC Press Release: Third Quarter Fiscal 2024 Results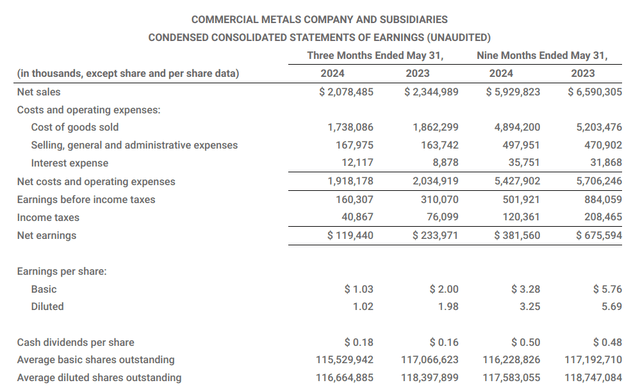
Additionally, we see that North America accounts for the largest portion of net sales by far for the company, and the same saw a decline of 8% since May 2023, while that of Europe saw a decline of 36% over the same period.
CMC Press Release: Third Quarter Fiscal 2024 Results
When looking at net sales on a longer-term basis, we can see that for 2024 – net sales for the quarters of both February and May are lower than that of the prior year quarter – and the most recent quarter remains substantially lower than the high of $2.515 billion as seen in May 2022.
Figures (in millions) sourced from historical Commercial Metals Company quarterly reports. Heatmap generated by author.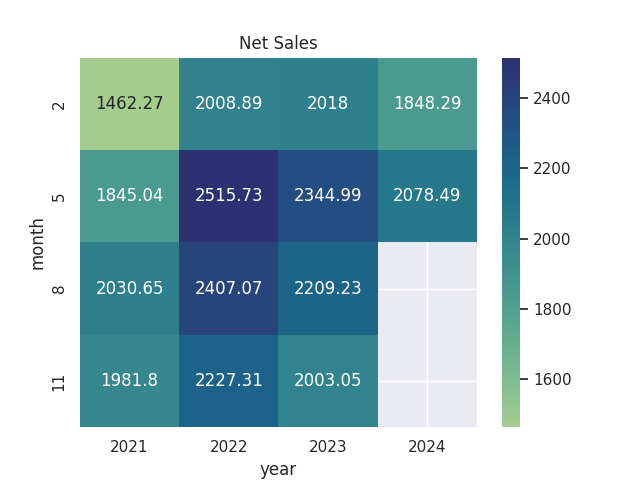
From a balance sheet standpoint, we can see that the quick ratio (calculated as total current assets less prepaid and other current assets less net inventories all over total current liabilities) has seen an increase from 2.17 to 2.46 and remains substantially above 1 – indicating that the company has sufficient liquid assets to service its current liabilities.
| Aug 2023 | May 2024 | |
| Total current assets | 3,144,155 | 3,239,628 |
| Prepaid and other current assets | 276,024 | 283,845 |
| Net Inventories | 1,035,582 | 1,075,176 |
| Total current liabilities | 843,714 | 764,954 |
| Quick ratio | 2.17 | 2.46 |
Source: Figures (except quick ratio) sourced from CMC Press Release: Third Quarter Fiscal 2024 Results. Quick ratio calculated by author.
From a longer-term standpoint, we can see that see that the long-term debt to total assets ratio has remained virtually constant over the same period.
| Aug 2023 | May 2024 | |
| Long-term debt | 1,114,284 | 1,137,602 |
| Total assets | 6,639,094 | 6,710,231 |
| Long-term debt to total assets ratio | 16.78% | 16.95% |
Source: Figures (except ratio) sourced from CMC Press Release: Third Quarter Fiscal 2024 Results. Long-term debt to total assets ratio calculated by author.
On a holistic basis, we have seen that while net sales have come under pressure this quarter, the company’s balance sheet has continued to remain healthy.
With that being said, it is also worth noting that while we have seen growth in the stock price over the past year, this may be influenced by share buybacks – most recently a $47.94 million buyback in February. Additionally, with interest rates remaining at 5.50% and the Federal Reserve having recently kept rates at current levels to bring down inflation – share buyback activity could slow from here due to higher interest rate costs and we could see more moderate growth in the stock price as a result.
Looking Forward and Risks
In terms of growth prospects for Commercial Metals Company going forward, this will hinge significantly on the trajectory of steel prices and market dynamics more generally.
For instance, steel prices in the United States continue to see downward pressure on the basis of increased imports from Vietnam which has been placing pressure on domestic prices. In particular, flat rolled steel import volumes from Vietnam saw an increase in average monthly volumes of 453% for the first five months of 2024 as compared to the same period in 2023.
Moreover, this has raised concerns that Vietnam is being used as a dumping ground for Chinese steel, whereby the materials origin is obfuscated in order to avoid duties on the same. Should we see this trend accelerate, then this could continue to place downward pressure on steel prices, and the downward pressure we have seen on net sales across the North American market could persist.
We have seen that the steel products metal margin per ton has fallen to $538 from $595 in the prior year quarter, and steel products shipped in external tons over the same period fell from $788 to $764 while the average selling price per ton was down to $891 from $979 in the prior year quarter.
CMC Press Release: Third Quarter Fiscal 2024 Results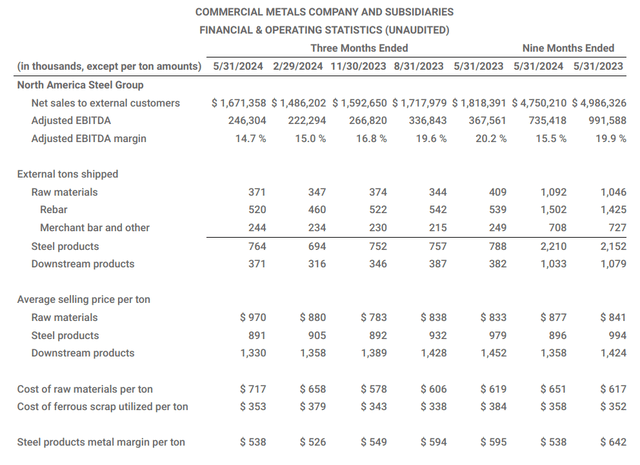
With that being said, one potential area of growth for the company to counteract the effects of lower steel prices is increased infrastructure activity driving demand across construction across North America this summer, which is also the case in Europe where we are seeing lower inflation and higher economic growth across key markets such as Poland, which is also spurring construction demand.
Commercial Metals Company reports that a significant shortage of housing units still exists across residential markets, and thus the company is in a good position to grow sales volume to counteract lower prices in the short to medium-term.
In terms of valuation, we see that the company’s forward P/E ratio is trading near a five-year high, while earnings per share (on a normalized diluted basis) has been declining since the beginning of 2023.
ycharts.com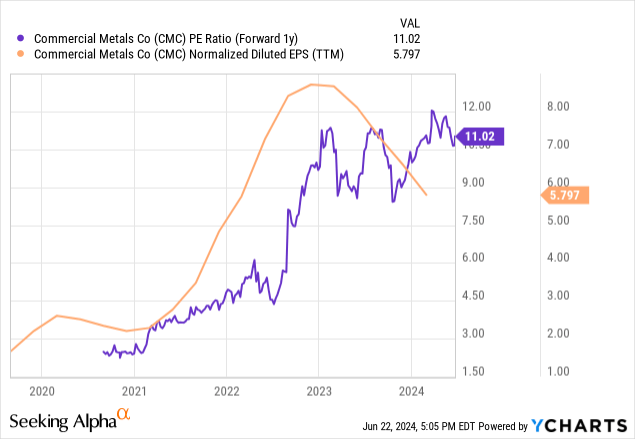
We see that Commercial Metals Company’s forward P/E ratio, we see that it is within the range of peers Steel Dynamics Inc (STLD) and Nucor Corp (NUE).
ycharts.com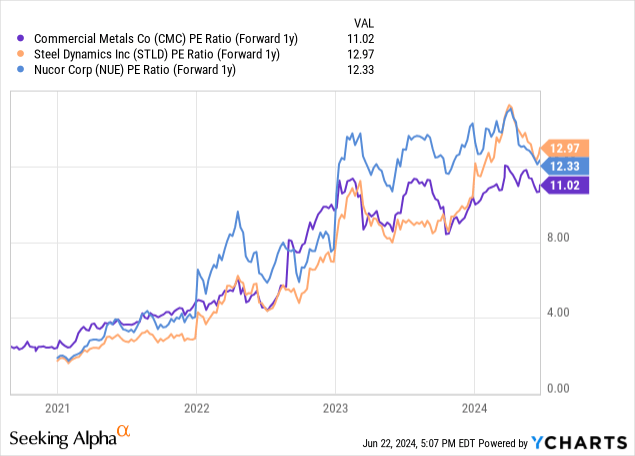
Taking the above into consideration, I take the view that the stock is fairly valued at this time and earnings needs to see a rebound to justify further upside from here.
Conclusion
To conclude, Commercial Metals Company has seen an improvement in net sales as compared to the previous quarter, but performance for both net sales and earnings is down as compared to that of the prior year. I take the view that while the stock has the potential for longer-term upside, this will hinge significantly on the degree to which steel prices start to see an upswing once again. I rate the stock as a Hold at this time.
Read the full article here


