Contextualization and Investment Thesis
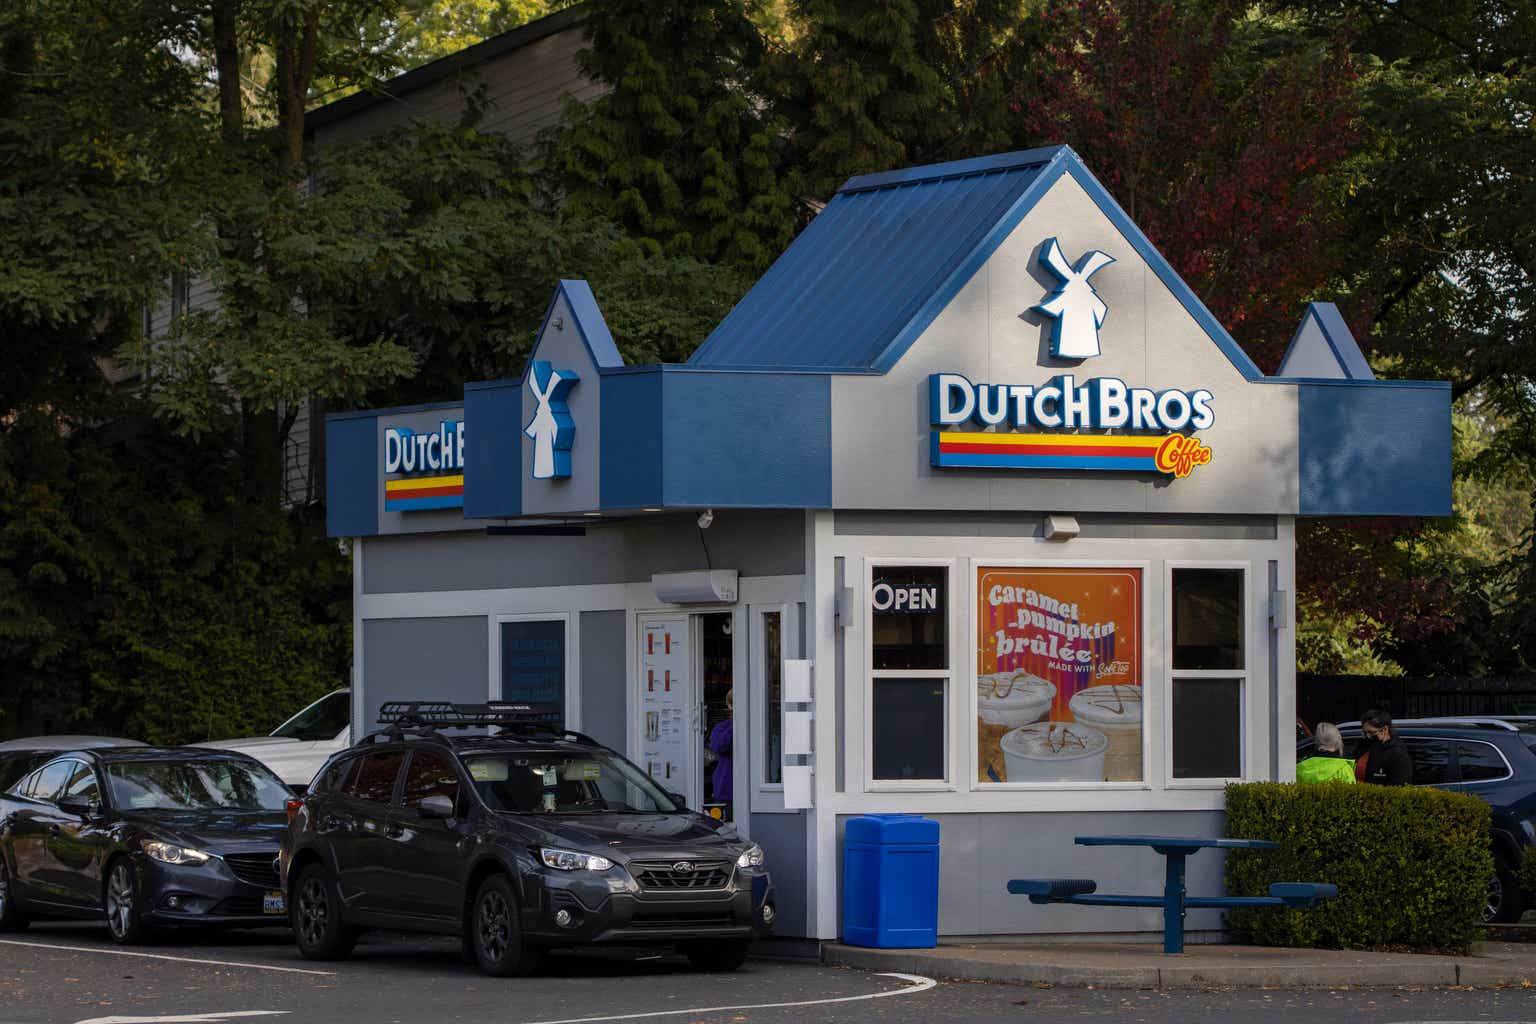
Dutch Bros (NYSE:BROS) is a drive-thru restaurant operator and franchisor that has been in the industry since 1992. With a very characteristic organizational culture, a value proposition based on brand authenticity and the creation of other non-functional benefits that make up the customer experience and differentiate Dutch from other regional operators.
In addition to its authenticity and characteristics that are qualitatively positive for an operator within the QSR segment, what is making the market look so fondly at this company? To put it into context, since its IPO in 2021, Dutch Bros has performed well above the industry average (in six months Dutch’s performance was 1,076.35% above the restaurant industry overall), and even more so when we put it into perspective Quick Service Restaurants are going through a very characteristic moment, with large operators entering a spiral of promotional environments with the aim of increasing unit turnover.
Even so, the most price-sensitive guests are still reluctant and this is evident when we look at the data on the number of visitors. Faced with this situation, not all segments of the industry suffer equally. We saw stronger results in the casual dining segment in this first quarter, even with the alleged storms in January, many casual dining restaurants managed to increase the average check per customer and compensate for the decrease in the number of guests (which, by the way, increased as the quarter developed). As I said previously, the QSR segment is typically quite sensitive to prices and the strategy of increasing the average check would not work without first causing undesirable effects. And here we can see the first difference between Dutch Bros and the rest of the industry.
While the QSR segment showed weak traffic results and neutral SSS results, Dutch performed well in these two metrics during Q1 2024. SSS growth was 10.9% system-wide and 10% in its own units, this was the strongest growth since Q4 2021. To have some basis for comparison, Wendy’s (WEN) showed an SSS of 0.6% in the first quarter and slower traffic, which was overcome in recent months with the reacceleration of the daytime park by account of the expansion of sources of income from breakfast. Starbucks (SBUX) showed a 3% drop in SSS and a 7% decline in transactions, with an even more challenging scenario in international markets (6% decline in SSS in operations outside North America with a decrease in ticket average of 3%).
Note that the ability to maintain growth in both SSS and traffic while the industry is slowly sinking indicates that Dutch is maintaining an interesting competitive advantage. Note that I did not say that Dutch is succeeding in these two tasks without increasing its prices, but rather that Dutch’s guests are not being as sensitive to price increases as other competitors in the segment. An example of this is that the increase in contribution margin in Q1 2024 had as its main catalyst the increase in prices (around 82% of the growth in Dutch’s contribution margin was related to the increase in prices).
There is a very interesting detail in this whole story that makes all the difference. Starbucks’ relative weakness in Q1 2024 is precisely due to occasional customers. I mean, consumers already loyal to the company, subscribing to Starbucks Rewards increased membership by 13%. Within this niche, customers consumed more, but not enough to cover the absence of occasional consumers. What it seems to me is that Starbucks would rather maintain its premium pricing than get into a price fight with operators like Dutch, which means a clear path to sailing among these occasional customers. This scenario is also repeated in China, with co-CEO Belinda Wong making it clear that she does not want to get into a potential price war.
Now, the most important task for Dutch is to take advantage of the fact that Starbucks is avoiding going headlong into promotional environments and retain occasional customers. This is where the company’s intrinsic characteristics come into play. Starting off on the right foot, Dutch has shown excellent adherence to Dutch Rewards, totaling approximately 66% of all transactions carried out within this loyalty program. When we compare it proportionally with Starbucks Rewards, we notice that adherence to the Dutch program is approximately 7% higher!
Another way for Dutch to take advantage of this golden opportunity to raise awareness among occasional guests and build their loyalty is through its staff. As I said previously, ‘broistas’ are a fundamental part of Dutch’s value proposition. And I’m not the one saying this, the company recently appeared in the top 10 on the list of best customer service services by Forbes, being one of the only brands offering quick customer service. This is particularly interesting when we consider orthodox service management theory and the concept of “moments of truth”.
Basically, moments of truth in service management are a series of perishable opportunities in which organizational elements come into contact with the customer and naturally make a certain impression. As Dutch is a quick service company that presents micro opportunities for creating added value other than the industry classics – convenience, price and practicality, it requires management to have much more refined control over points of contact with the customer and the creation of perceived value in a few minutes.
It’s like I always say: “Behind every motivated team and good service management, there are even better people management policies.” One of these policies refers to the goal of achieving approximately 100% of promotions to management positions through internal selection. This also involves a career plan superior to that offered by other companies in the same sector. I say this because the company has more than 375 candidates for management vacancies with an average of seven years of experience, fully capable of taking on positions as operators during the expansion project. If everything goes according to plan and the company reaches the target proposed by the 2024 Outlook and opens 165 units, approximately 44% of these talents will have already been relocated to new units.
As if the factors I already mentioned were not enough, we have an expansion project. And one of the big ones. The company intends to reach a total of 4,000 units spread across the United States in the medium/long term. Dutch currently has 876 units spread across 17 states and more than 430 cities. In Q4 2023, Dutch had a total of 831 units, 542 of which were owned and 289 were franchises. We note that unit growth in the quarter was 5.4%. However, planned growth for fiscal 2024 is 19.85% at best. Currently, with the recent opening of a unit in Florida, Dutch is finally a company that covers the United States from the Pacific to the Atlantic.
As the company expands to the Center and East of the country, the needs for storing green coffee beans and their transportation across the country grow. It is clear that Dutch needed a more optimized logistics system. Nothing more normal, situations like this are part of growing pains. This pressing need for roasting facilities (as the company operated from a facility located in Grants Pass, OR from the beginning) resulted in the opening of a new roasting facility in Melissa, TX.
The choice of Texas as a strategic location was the right one in my opinion, as the company expands its units to the East there will be an increasing need to supply inventories (even more so if we consider the growing appeal among occasional consumers). This will help the company reduce its Operating Cycle and Cash Cycle, allowing for more efficient management of liquidity and cash flow. And remember, managing liquidity and cash flow in companies that are growing is something that should always be taken into consideration.
Another fundamental pillar of my thesis in Dutch is the optimization of labor costs in relation to the industry. As we know in advance, there is significant pressure in relation to labor costs not only due to wage inflation, but also from regulatory pressures and forces that are not necessarily market, but rather interventionist (mainly in QSR’s). That said, I recognize it as a competitive advantage for Dutch, as well as one of the main points of my investment thesis, the company’s progress in reducing labor costs in relation to revenue. Since 2021, Dutch has been successful in reducing labor operating costs in relation to revenue from 30% to 26% in 2023. In my opinion, the two most important factors driving this reduction are the drive-thru business model that allows for the optimization of personnel and the integration of technologies that optimize the park’s turnover.
As Dutch’s business model is generally known, here are some explanations about these technological integrations that allow for the optimization of labor costs. Since last year, Dutch began testing some order-ahead features within its app. These tests are being conducted primarily within Arizona. Even though we are still receiving some feedback from employees and guests, the results are proving to be efficient. This indicates to us that this will likely be a tailwind in reducing operating costs, serving as a buffer if any other cost center increases abruptly. Why am I so confident about this new feature? Simple, the test market method is quite accurate in its results. The simulation, implementation and cost savings resulting from this feature in Arizona will most likely result in a reduction in labor costs throughout the system. And the most important thing is that the time and work optimization that this new resource will offer can be used by Dutch to further improve the customer experience.
In short, my investment thesis in Dutch Bros is based on a few pillars:
- Sustained growth and appeal: The company was successful in delivering both a positive SSS and traffic despite increasing its prices during Q1 2024. This is highly positive as it indicates that its guests are not as price sensitive as other companies in the segment;
- Vacuum and acquisition of non-occasional customers: As Starbucks intends to maintain its premium pricing and stay away from promotional environments, price-sensitive guests are no longer attending its locations. This is evident from the weakness of occasional guests during Q1 2024. This creates a golden opportunity for Dutch to retain these guests through its loyalty programs, which have proven to be very effective;
- Ability to build loyalty and recognition of the service: With the aforementioned opportunity knocking on the door, I believe that Dutch is well positioned to retain these customers. The ability to deliver a good service is the result of a successful people management policy;
- Expansion project: With sales metrics growing and the brand’s appeal to the target audience being verified, this scenario indicates that the tendency for Dutch’s expansion is to generate good results that will be perceived through sales growth and other metrics such as AUV and SSS. Although the ambitious project of 4,000 units is far away, the company is growing at a rapid pace. An example of this are the latest quarterly results, where the number of owned units increased by 33% while revenues from these same units grew 43% compared to Q1 2023;
- Projection of improving cycles, mainly regarding inventory renewal: As I said previously, Dutch showed several liquidity and cash flow problems in 2021 and 2022, effectively when it began to immobilize current resources. Solving this need for liquidity through long-term financing, the company still maintained a very long Operating Cycle largely due to the roasting installation and the import of coffee beans. With a new roasting facility in Melissa, TX, the tendency is for the company to present a much more positive situation in relation to its liquidity and all the other benefits provided by good capital allocation;
- Reduced labor costs guaranteed by the business model and integration with technology: Despite presenting low percentages in relation to the industry with labor costs, Dutch is implementing a system that is in the testing phase that will further optimize its people management. This change, combined with its business model, will allow the company to focus on creating value for the customer and building loyalty.
Overload Risks and the Dreaded “Scissors Effect”
For those who don’t know what these two terms mean, I’ll explain. Overtrade means doing business in proportions greater than available resources. In other words, a company that entered Overtrade has been carrying out a large volume of business without having sufficient adequate resources to finance its need for working capital. Generally, companies that experience this phenomenon experience extremely accelerated growth without the appropriate sources of financing and have a non-optimized capital format.
Scissor Effect is a more complex phenomenon, but also intrinsically related to Overtrade. When a company grows suddenly, its operating accounts also grow. The mismatch between current operating assets and current operating liabilities also increases the need for working capital, as well as harming cash flow and liquidity.
Despite being similar, a company can face the consequences of the Scissor Effect without showing growth in its revenues. Overtrade is umbilically linked to the issue of sudden increases in sales. But why am I relating these two concepts in my analysis of Dutch? For those who don’t remember, in the last two fiscal years Dutch had structural problems that were caused by Overtrade, resulting in worrying symptoms of the Scissor Effect within the operational accounts and this shaped how management allocates capital nowadays.
It all started in 2021. Dutch had its IPO and raised more than $500 million. Expansion planning was and still is very capital dependent. The desire to immobilize its own capital ended up leaving Dutch without many options for financing its operational accounts other than through short-term debt. It turns out that the company was not using this line of credit in a punctual and moderate manner, but rather in an irresponsible manner. In 2021, the IPO year, short-term debt expenses were $64.1 million. The following year this value reached $110.9 million, almost double the previous year.
Even with constantly high revenues and precisely for this reason needing a greater amount of working capital to finance its operational asset accounts, at the same time as its liquidity was drained by short-term debts, the company went through difficult times. When I say difficult times, I don’t mean operationally. The business was growing, but there was a constant need for liquidity that pushed the company deeper into debt.
Naturally, this problem was resolved last year, through a long-term line of credit. By increasing its non-current resources, the company will be able to enjoy some peace of mind while keeping part of these resources invested in current assets. And it is because of this need for liquidity and negative cash flow (since Capex expenses exceed OCF) that there is an investment in which Dutch maintains a large amount of cash.
How Does This Impact Dutch Bros?
I told this whole story to highlight to you two important aspects that surround the risks of investing in Dutch, at least when we talk about a managerial level. The first is that despite the liquidity problems being partially resolved, the company still has a negative cash flow. This means that it is highly dependent on these long-term lines of credit to maintain its activities, including expansion. Given the circumstantial dynamics that Dutch is going through, reliance on a long-term line of credit is the best option. But it is still a risk that investors need to be aware of.
One more addendum regarding debt. Over the last two years Dutch has managed to both increase its return on debt and reduce the cost of debt by increasing its proportion within its financing sources.
Another impact arising from the capital structure that we must take into consideration is the limitation of profitability on invested capital. We know that maintaining liquid assets in current accounts mitigates the effects of poorly planned immobilization and the constant need for liquidity. However, there is a diametrically inverse relationship between liquidity and profitability. This relationship requires the financial manager to prioritize one of these two figures in favor of the company’s structure. When Dutch effectively keeps $262.7 million in cash, it stops investing part of that capital in more profitable assets.
The good news here is that even with a very large need for liquidity and consequently a large amount of capital parked in current accounts, Dutch has very satisfactory profitability rates. An example of this is CROIC. Of course, when compared to Starbucks, Dutch still lags behind in this regard, but remember, we are analyzing a growth company. We’re not seeing your best version of Dutch right now. We need to equate its potential when it actually presents a comparable economy of scale. Regarding the evolution of CROIC, we can see that it has been improving year after year, this is a sign that its assets are maturing while the company still uses capital more intensively.
Author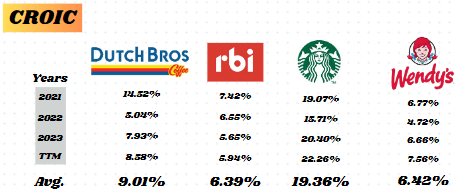
Due to the intensive use of capital and underlying expansion of operations, Dutch has been presenting a negative FCFROIC. This indicates that its investment activities surpass the amount of capital generated by its operations. The most important question for us here (as we already imagined a scenario like this for growing companies) is when will Dutch actually present an operating cash flow that exceeds Capex? This issue is fundamental, since from this point onwards Dutch will present a positive FCF.
Author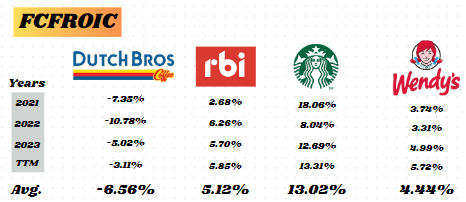
A good sign is seeing that Dutch’s cash flow is growing rapidly. Last year the company surpassed the industry’s median growth by more than 300%. This is due to the faster growth of OCF than Capex. Currently OCF growth is 51.57%, while Capex has grown 26.91%.
To measure the incremental return on invested capital, we will use ROIIC. This indicator will help us understand how a change in invested capital is impacting operating profit. Thus, an ROIIC closer to 1 indicates that the company is generating consistent returns on invested capital. This indicator is essential for measuring the sensitivity and maturity of investments in growth companies.
Author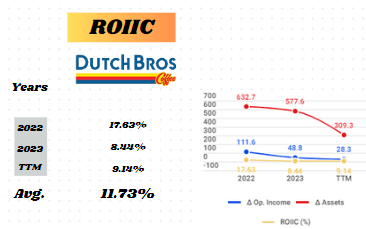
Note that since the IPO, the company has been increasingly responsive (in the form of operating profit) based on the capital invested. This means that even with profitability hampered by the need to maintain liquidity, the investments made by the company are proving to be increasingly responsive. This corroborates what we saw about operational performance (considerable increase in sales and contribution margin at store level).
Valuation
Taking a look at the ratios. For companies that are growing, I like to look at the Price/Sales ratio first and foremost. This way we isolate earnings and focus only on sales growth in parallel with the share price. Based on revenue expectations for the next 12 months, Price/Sales indicates a multiple of 2.77, a little more than twice as high as the industry median. However, Dutch is not much different from companies like Starbucks, which has a Price/Sales of approximately 2.55 or Restaurant Brands (QSR) with 2.59.
This is justifiable by Dutch precisely due to the growth rate of its revenue, which showed a CAGR of approximately 43% in the last three years. Starbucks and Restaurant Brands, despite being companies with stronger strength and free cash flows, have a three-year CAGR of 15% and 12.75% respectively. In other words, Dutch’s accelerated growth presents almost triple the growth of Starbucks and more than three times the growth of Restaurant Brands at a price just a little higher (if we look at Price/Sales). That said, we can adapt our Price/Sales formula to the PSG ratio, considering revenue growth. Thus, Dutch has a PSG of 0.1, while Starbucks has 0.33 and Restaurant Brands has 0.18.
We can also use the PEG ratio to adjust for differences in EPS growth between different companies. This means that high-growth companies like Dutch, which have higher P/Es, when adjusted for growth rate, become more comparable to mature, slower-growing companies. Dutch’s PEG ratio is 2.27 (I used the 96.70 P/E estimate for the end of fiscal 2024 and an EPS growth rate of 42.53%). The PEG ratio of Starbucks is 1.96, Restaurant Brands is 2.75, Wendy’s is 2.08, Yum! (YUM) is 2.04. Note that the company does not seem to be as overvalued using the PEG as it is when we just look at the P/E.
Another metric that we can use in our evaluation and comparison of multiples is the Price/Cash Flow to Growth Ratio (PCFG Ratio), which is a metric derived from Price/Cash Flow. If we use P/CF without considering cash flow growth, Dutch has a multiple of 53.23, which is more than four times the industry median! Adapting to the growth in cash flow through PCFG, Dutch now presents a multiple of 1.03. Still, Starbucks (a very strong cash generator) has a PCFG of 0.98, Wendy’s of 0.69, and Restaurant Brands of 2.21.
Dutch by PCFG is still above the industry median, but note that when we adjust based on growth the numbers are not that different. Let us also remember that Dutch is not yet a strong generator of cash flow, given the investment maturation time and the need for liquidity that still forces it to maintain too many current assets.
That said, I believe I showed you that despite the slightly stretched multiples, it is difficult to say that Dutch is an overvalued company just looking at traditional metrics. Growth metrics indicate that there is still room for a sustainable purchase with a margin of safety for the long term.
For DCF we need to make some important assumptions. In the scenario we are projecting, Dutch will end the year with FCF at 2021 levels. The WACC is 7.74% and there is FCF growth in line with EBITDA, as this is a proxy (not as reliable as other metrics , but it will serve us) for the FCF. We use the perpetual growth rate at 2.5%.
Author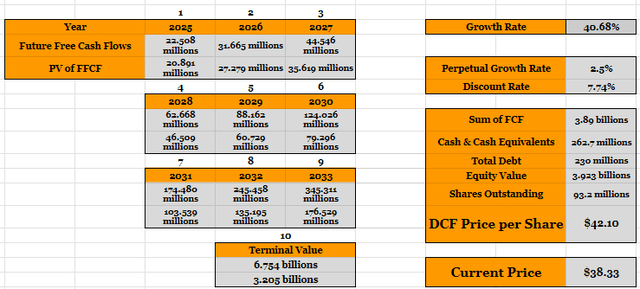
Note that even using these assumptions, which are still quite nebulous (since we don’t know when the company will reduce its investments or even when they will need to be replaced by third-party capital), I still see room for growth of approximately 10% in the share value, or even more given the circumstances of occasional customer loyalty.
Conclusion
In short, I see Dutch Bros as a high-value, high-growth company, but not just that. In reality, there are environmental circumstances that are serving as headwinds for something much more beneficial than the simple succession of positive results, but the dominance of a significant portion of the market.
Being well positioned to retain this significant portion of occasional customers is only possible through PoDs that allow generating appeal through perceived benefits. And that’s what we’re seeing right now with an increase in both SSS and traffic. And that is the most important step.
Another metric that I expect to continue following the same upward path in the short term is operating margin. I would like to see the impact of mobile applications and the process redesign that is already happening in Arizona, mainly related to labor costs. Naturally, I would also like to evaluate in the future how the company is dealing with the surplus of employees now tasked with value-creating activities.
Regarding the capital structure, I don’t see room for any changes. Everything is running like clockwork the way we are seeing it. In other words, an excess of liquidity in a capital-dependent company is better than a lack of it. And since this is not impacting Debt Efficiency, I don’t see any problem for now.
Read the full article here


