The BlackRock U.S. Equity Factor Rotation ETF (NYSEARCA:DYNF) invests across a diversified group of large and mid-cap U.S. companies.
The attraction here is the fund’s actively managed strategy that considers each return factor exposure the portfolio management team believes is best positioned based on forward-looking insight. Favorably, DYNF is up more than 30% over the past year, capturing the strength of the broader market.
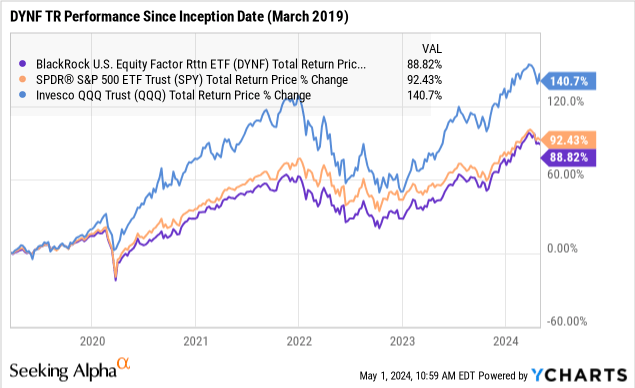
That said, we find that DYNF’s historical record leaves a lot to be desired. With an inception date in March of 2019, the fund has underperformed the S&P 500 while also proving to be more volatile during the last market downturn.
We’ll break down where DYNF fails to impress and why we don’t recommend the fund.
What is the DYNF ETF?
DYNF takes a data-driven or “systematic approach” to allocating across U.S. stocks through a factor rotation model. Starting with top-down signals between the economic environment, market valuations, and investors’ sentiment, the strategy attempts to identify stocks that capture and represent recognized equity performance drivers.
The specific style factors DYNF focuses on include:
- Quality – measured by how financially sound a company is.
- Valuation – stocks that are perceived as inexpensive.
- Size – mega-cap leaders compared to smaller companies.
- Volatility – a stock’s beta profile.
- Momentum – winners tend to keep winning.
- Growth – companies with higher levels of sales expansion.
source: BlackRock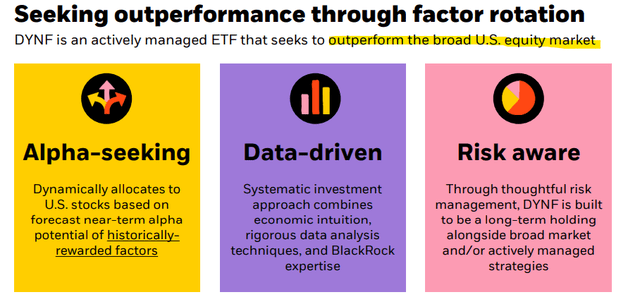
Depending on the stage of the market cycle, different factors are seen as better positioned as part of the tactical allocation process. The fund manager is expected to rotate the portfolio as market conditions change.
According to the latest update from BlackRock, DYNF expresses a tilt toward stocks with higher momentum and high growth indicative of an expansion phase in the economy. There is also a current focus on mega-cap companies, while the value factor can be described as balanced.
source: BlackRock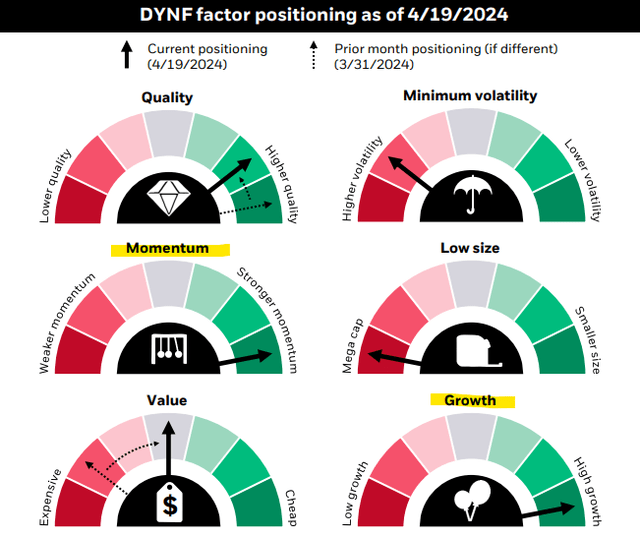
DYNF’s positioning is also indicated through the sector allocation, where the fund’s 37% weighting toward Technology sector stocks has a relationship to the momentum and high growth factors.
This is consistent with market themes over the last several months where tech has outperformed, and the market has rewarded high-growth companies. At the other end of the spectrum, the fund excludes Utilities and is underweight in most other sectors compared to the S&P 500.
Seeking Alpha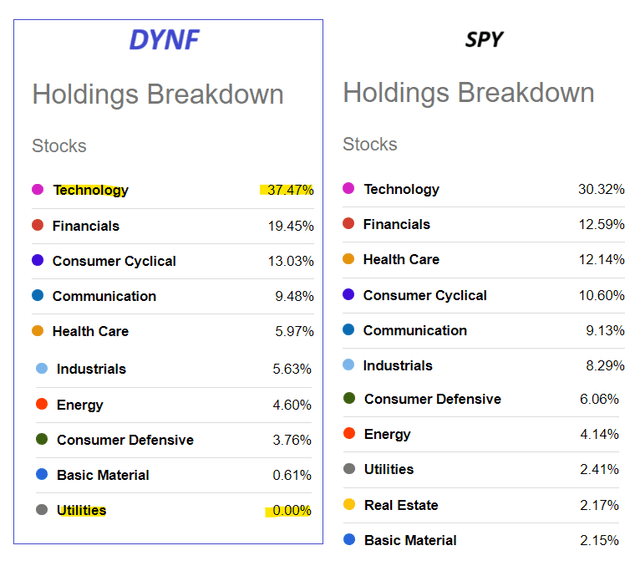
We make the connection with the S&P 500 based on a large overlap of investments. While the DYNF portfolio is more concentrated with 135 stocks, familiar “MAG 7” names like Microsoft Corp (MSFT), NVIDIA Corp. (NVDA), Apple Inc. (AAPL), Amazon.com, Inc. (AMZN), Meta Platforms, Inc. (META) and Alphabet Inc. (GOOGL) are within the top 10 holdings.
source: company IR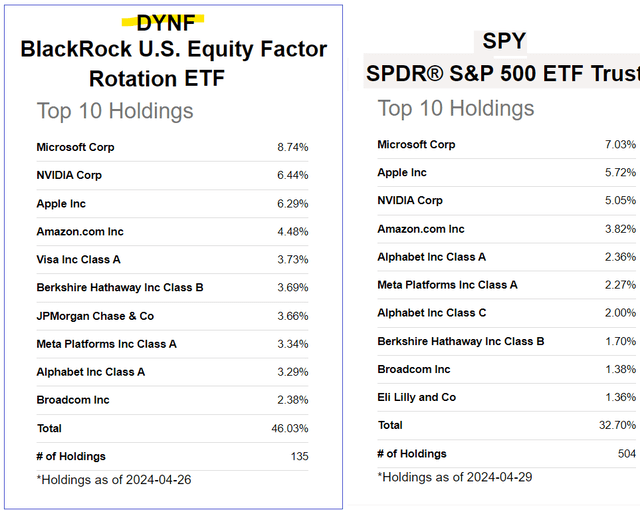
In effect, DYNF is overweight key stocks that performed well over the past year which proved to be a winning strategy with the fund returning 30% over the past year, well above the 23% return by the SPDR S&P 500 ETF Trust (SPY).
On the other hand, we note that DYNF’s performance is less impressive against the Invesco QQQ Trust (QQQ) which has modestly delivered a higher return of 31% over the same time frame.
The Nasdaq-100 Index is relevant here because it has a similar overweight exposure to tech stocks and the momentum/growth factors relative to the S&P 500 as DYNF currently presents.
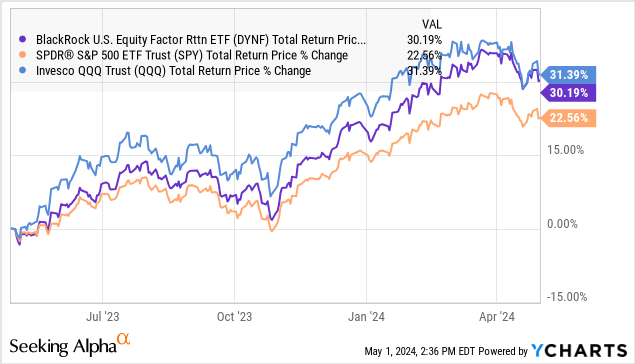
The point here is to say that DYNF has a current positioning closer to QQQ but has the flexibility to rotate more toward the S&P 500 factor profile, or even more defensive during different market cycles.
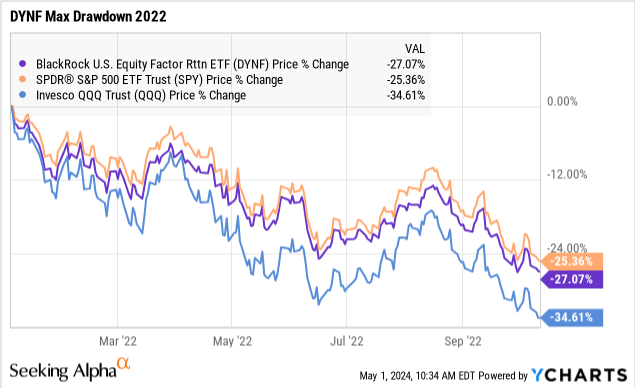
2022 offered a good example of how DYNF can perform during a historically volatile and difficult period in the market. In this case, the fund went through a -27% drawdown that year, less extreme than the -35% correction in QQQ, but marginally worse than the -25% decline in SPY.
If we go back to that first chart at the top of this article, which shows DYNF has underperformed the S&P 500 and QQQ since inception, our takeaway is that it also carries a higher level of risk compared to SPY.
What’s Next For DYNF?
The main weakness of any factor rotation strategy is the timing lag in identifying major pivot points in the market where different factors may begin to work better. Growth and momentum have been strong themes over the past year, but it’s far from certain those same trends will continue to deliver.
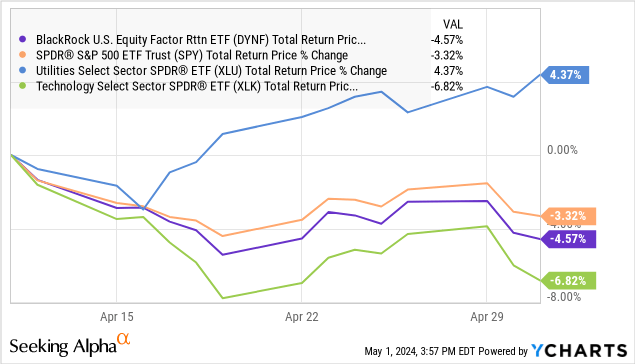
We’ve already seen some of that play out in recent weeks amid the latest round of market volatility. Tech stocks have pulled back from highs while the utility sector, which DYNF completely excludes, has outperformed. FDNY has lagged SPY over the past month, which can be explained by this lack of diversification and concentration in tech.
While the fund will likely make adjustments to its factor positioning to reflect the changing environment, the setup here highlights the challenge of staying ahead of the market.
In the context of the current market, we expect the uncertainty surrounding the trajectory of inflation as well as the timing of potential Fed rate cuts to translate into ongoing volatility for stocks.
Final Thoughts
We haven’t seen enough to suggest the BlackRock U.S. Equity Factor Rotation ETF is a more attractive or superior alternative to a passive broad-market equity index fund such as SPY.
Sometimes, simplicity is best, and we sense DYNF attempts to do too much but ends up being overly complicated. Ultimately, the fund can continue delivering positive returns as it has in recent years alongside the broader market, but we don’t see it materially outperforming.
We’re willing to give the strategy the benefit of the doubt, acknowledging that the next five years could prove to be more fruitful. Still, we’ll pass on the fund, as it’s not worth taking a position to find out.
Read the full article here


