Overview
The rise of interest rates has left many investors scrambling to find the best deals in the market. Unfortunately, many people in the world are on the wrong side of the cash register; they provide the dividends, interest, and debt for the major corporations in the world and dish out most of their wealth without even knowing it. What if there was a way to capitalize on this elevated rate environment and get on the other side of the cash register by instead collecting the dividends, interest, and debt from others? Welcome to the world of Business Development Companies, known as BDCs.
BDCs like Crescent Capital (NASDAQ:CCAP) provide an opportunity to collect a high distribution from the current rate environment that we are in. Their business model is to provide a mix of debt and equity financing to different portfolio companies across different industries that need funding. As a result, they collect interest, dividends, or recognize capital gains as a means of income on these investments. As a shareholder, you get a slice of the action by collecting a high dividend yield of 9.5%. What I like about BDCs is that you don’t typically rely on these portfolio companies to exceed expectations the way you would with a normal equity like stock. For example, with a company like Tesla (TSLA) there are clear expectations of delivering sales growth year over year. Failure to do so, even if growth remains flat, results in lighter returns or a falling share price. This is not how it works for BDCs.
Instead, the investments that BDCs make only require these portfolio companies to be able to make their scheduled debt payments and maintain a healthy balance sheet. Even if the portfolio companies see light to moderate growth, you are still collecting a high yield so long as they are able to maintain the required interest payments. This is what makes a BDC like CCAP attractive in a higher rate environment, where interest income can be elevated.
Strategy & Portfolio
Another bonus to a BDC like CCAP is that they are diverse in nature. CCAP current has 186 portfolio companies they are exposed to. The goal here is to mitigate any sort of concentration risk from a specific industry. In addition, the investments that CCAP make have global exposure. The majority of the investments are US-based (89%) and the remaining percentage is split between Europe, Canada, and Australia & New Zealand. The portfolio companies are spread throughout different industries, with the top 5 industries being the following:
- Health Care Equipment & Services: 26%
- Software Services: 18%
- Consumer Services: 10%
- Insurance: 5%
- Diversified Financials: 3%
The top ten individual obligors’ makeup about 14% of their portfolio, with an average position size of $9M per holding. We can see that the majority of their investments are classified as first lien debt and also floating rate. The first lien loans are a great addition to the portfolio because it offers a layer of security in the case of defaults within. According to the capital structure, first lien debt always has priority in terms of repayment when liquidations take place. This concept offsets risk a bit alongside the floating rate exposure.
CCAP Q4 Presentation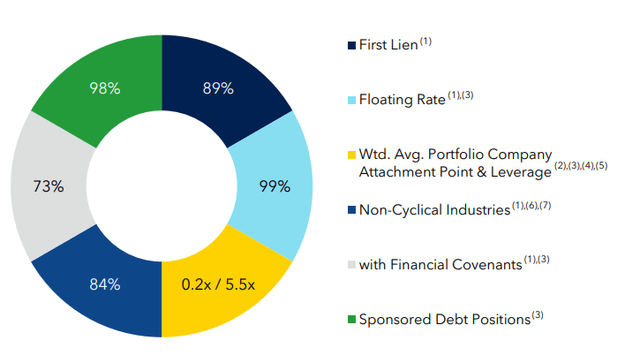
A portfolio of debt with floating rates is also great for times when interest rates are rising. Although we may not see additional rate hikes, I do believe that the days of near zero rates are far behind us. This is supported by the latest CPI report that showed rising inflation and a strong labor market. As a result, there just isn’t much incentive to start cutting rates to those lows once again. When interest rates remain elevated, this means that CCAP can capitalize by raking in more net investment income, referred to as NII.
Financials & Dividend
As of the latest Q4 earnings, NII was reported at $0.61 per share. Since the last declared distribution was $0.41 per share, this means that the dividend is covered by about 148%. I have no worries here about the sustainability of the distribution, which can further be backed by the fact that CCAP also paid out a supplemental distribution of $0.10 per share back in March. In fact, the NII grew on a consistent basis since Q4 of 2022.
- Q4 2022: $0.52 per share
- Q1 2023: $0.54 per share
- Q2 2023: $0.56 per share
- Q3 2023: $0.59 per share
- Q4 2023: $0.61 per share
CCAP Q4 Earnings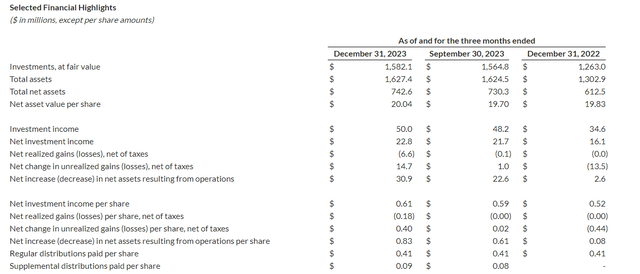
This latest earnings report closed off their full year 2023 numbers and there are a few things that standout to me. We can see how the fiscal year 2023’s net investment income grew to $22.8M, up from the prior year’s $16.1M. We can also see a healthy growth in NAV (net asset value) per share from 2022’s $19.83 up to 2023’s $20.04. Lastly, the weighted average yield on their income producing assets grew to 11.9% which means that CCAP is currently producing more income than the prior year.
Approximately 98.7% of their portfolio consists of floating rate debt investments. This is the likely contributor to such higher levels of NII. In addition, CCAP has been growing their portfolio with new portfolio investments as part of their debt portfolio. New investment activity has grown over the last few quarters, up to $88.5M. It’s always great to see that a BDC is making a consistent effort at allocating new dollars towards the growth of their portfolio.
This strong cash flow generation has been great for the distributions. The current dividend yield is 9.5% and even though the base dividend has not been increased, there have been plenty of supplementals. For instance, in Q2 of 2023 they announced a supplemental of $0.08 per share, followed by $0.09 per share in Q3 of 2023, and finally a $0.10 supplemental in Q4. This added a total supplemental amount of $0.27 per share, which is essentially a 65% buff on top of the base distribution of $0.41 per share.
While they have certainly capitalized from the higher rates and rewarded shareholders accordingly, I would love to see a base distribution raise as well. While distributions may slow if we do get rate cuts this year, I believe that the huge coverage still leaves ample room for the supplementals to continue, albeit, maybe a lesser in amount.
Portfolio Visualizer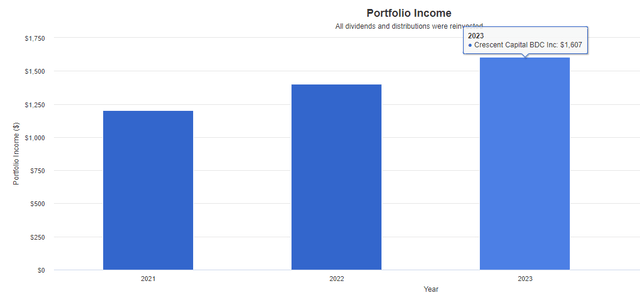
Even though CCAP’s history is a short one, the dividend growth from these supplementals has packed a serious punch. Running a back test from Jan. 2021 – March 2024, we can see that an initial investment of $10,000 would have produced large dividend growth assuming that dividends were reinvested. Your position size would now be over $16k and your dividend income would have grown from $1,200 in 2021 up to $1,600 in 2023.
Valuation
In terms of valuation, CCAP currently trades at a discount to NAV of -14.22%. The price has traded at an average discount to NAV of -18% for the last three years, so I will consider that as the baseline for a “fair value”. From this perspective, CCAP trades at a slight premium than fair value, but this makes sense considering all of the additional supplemental income that has been distributed out to shareholders.
CEF Data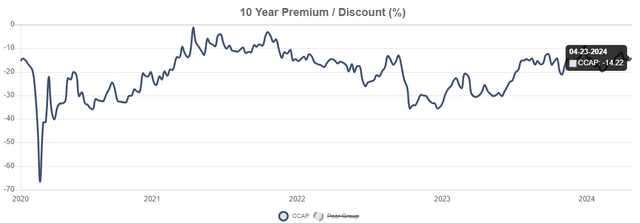
However, I am not concerned with the premium as much here. This is because CCAP offers a win-win scenario here. Even though the price trades above its historical discount range, you will still be rewarded with a higher level of distributions. Conversely, if you buy in now and rate are cut later on this year or next, there’s a chance that we see some nice price upside if the NAV shows some more growth. In 2015, the NAV per share was $19.90 and the current NAV per share sits at $20.04. While this is shows very little growth over nearly a decade, I still think it’s better than the NAV straight up decreasing.
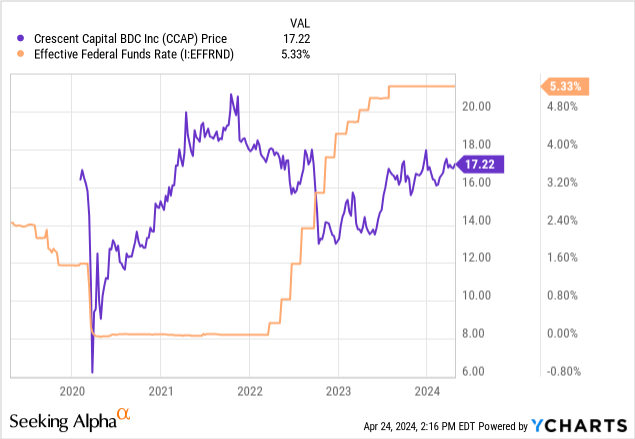
We can also see the inverse price relationship that CCAP has shared with the effective federal funds rate. When rates were dropped near zero after the COVID-19 crash, CCAP’s price rose to new highs over $20 per share. Once rates started to rise rapidly in 2022, the price started to come down and settled around the current range. If rates do get cut again in the future, this would allow CCAP to expand at a fast rate and may serve as a catalyst for price movement back upward. Therefore, I feel comfortable initiating a position here.
Seeking Alpha
Lastly, Seeking Alpha’s Quant gives CCAP a strong buy rating of 4.58. This is due to the combination of an attractive valuation rating, growth prospects, and profitability grades. For reference, the average Wall St. price target for CCAP sits at $18 per share. This represents a potential upside of 4.7% from the current price level.
Risk Profile & Comparison
CCAP has been pretty well managed in terms of risk when it comes to their investment portfolio. Each portfolio company goes through an internal rating system that grades the safety and quality of the investment. The grading scale is a numbering system of 1-5. 1 represent the highest quality portfolio company that is exceeding margins and has a surplus of capital to pay debts. A rating of 2 means that the investment is performing as expected and there is a level of risk level similar to the time of origination. For reference, most new portfolio companies land at a 2 rating.
An internal rating of 3 means the company is performing below expectations and the risk to recoup the original cost of the investment has increased. 4 means that the investment is performing materially below expectations and loan balances are past due but not more than 180 days. Lastly, a rating of 5 indicates that the investment is performing substantially below expectations and the ability to recoup losses is no longer expected.
CCAP Q4 Presentation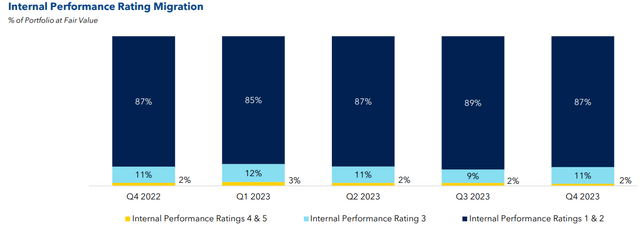
As we can see, the bulk of their portfolio companies land within the 1 & 2 rating, although I do find it suspicious that management chose to blend both these ratings into one section of the bar graph. It would be way more transparent to see an exact breakdown of how many portfolio companies land specifically at a 1 rating versus a 2 rating. My thoughts are that most of this category leans closer to the 2 rating, which is why they opted to display it this way. This means that about 15% of the portfolio companies are performing at levels that are not ideal. There is a chance that this extended period of higher rates cause additional financial burden on these companies, and their abilities to keep up with interest payments tighten.
This would likely cause the non-accrual rate to rise. Non-accruals have already reached 2% in regard to the cost of their investment. While this 2% has held steady so far, there is a chance we see this number increase over prolonged periods of high interest rates and inflation. However, I don’t see any reason for concern yet at these levels, since they have not increased. Ideally, we’ve like to see this non-accrual rate decrease over time. For reference, here are the non-accrual rates for some peer BDCs, as well as their performance.
- FS KKR (FSK): 8.9% non-accrual rate
- Prospect Capital (PSEC): 0.2% non-accrual rate
- Ares Capital (ARCC): 1.3% non-accrual rate
- Golub Capital (GBDC): 1.1% non-accrual rate
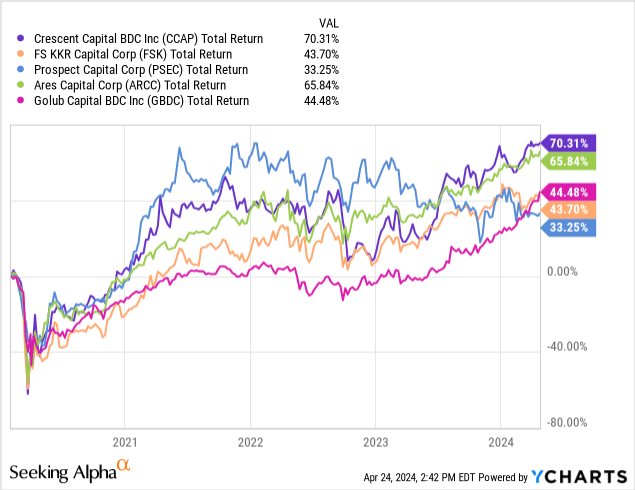
We can see that CCAP actually has a higher return profile than some of the peers that have a lower non-accrual rate. This shows that while non-accrual rates are certainly important, it doesn’t paint the entire picture here of the growth potential of the portfolio companies within. For example, PSEC has the lowest non-accrual rate but also the lowest total return out of the group. There are different factors at play like distribution amount, supplementals, portfolio value, and NAV growth that can contribute to total return.
Takeaway
Crescent Capital continues to out earn their distribution with a high margin of safety and can likely continue issuing supplementals as we remain in a higher interest rate environment. On the flip side, if rates get cut, we could actually see the price increase. I believe that CCAP sits at an attractive valuation and the portfolio quality continues to be solid, as proven by the increased levels of NII and stable level of non-accruals. The diverse nature of CCAP’s portfolio in combination with its floating rate structure make this a good BDC to capitalize on this higher rate environment. Therefore, I rate Crescent Capital as a Buy.
Read the full article here


