Despite a bumpy inflation road recently, Fed Chair Powell reiterated that the FOMC is likely to begin cutting rates sooner rather than later. What was particularly interesting about the March rate decision was that the committee raised both its inflation and growth forecasts, but generally kept its policy rate outlook unchanged.
Longer-term, however, a higher neutral rate was penciled in by the voting members. That should not come as a major surprise considering that technological advances, including what AI is poised to deliver, auger for higher real rates in the years ahead compared to the sluggish growth period of the previous decade.
Amid a host of other factors I will detail, I have a hold rating on the iShares 20+ Year Treasury Bond ETF (NASDAQ:TLT). I see long-term Treasuries as near fair value. Interest rate volatility has dropped to fresh 26-month lows as rate traders home in on a somewhat stable range when looking out on the yield curve. Following the March Fed meeting, bond traders seemed to have come to the realization that despite a healthy macro backdrop, upwards of three quarter-point eases may be on the way.
Despite Healthy Growth And Stubborn Inflation, 3 Rate Cuts Remain Priced Into 2024
BofA Global Research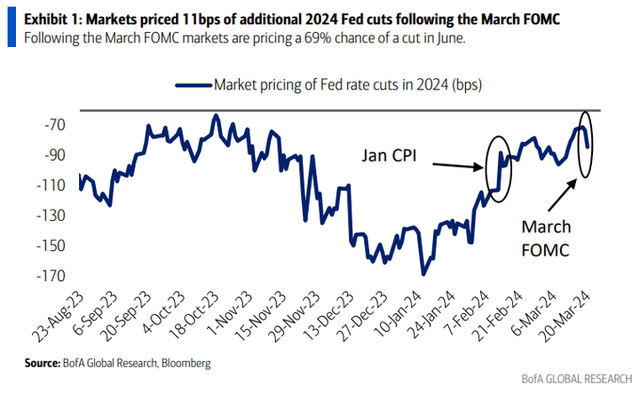
ICE BofA Interest Rate Volatility Index Drops To Its Lowest Mark Since January 2022
TradingView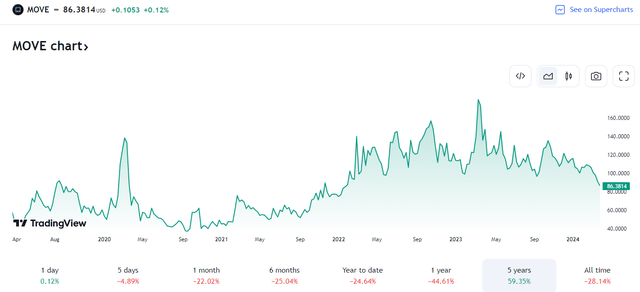
For background and according to the issuer, TLT offers investors exposure to long-term US Treasury bonds by holding maturities of 20 years or longer. Share-price momentum is very weak right now and has been for the last year. While its annual expense ratio is low at just 0.15% and with a yield to maturity of 4.44%, the ETF has lost some of its diversification benefits as stocks and interest rates have been moving together in the last two-plus years. As a result, TLT’s risk rating is poor but the fund is highly liquid.
Now, typically there is a bid to bonds following the final rate increase, as illustrated in the chart below. We really haven’t seen that play out since July last year – the Treasury market has been about flat for all intents and purposes. Stocks have obviously been ok with that price action. It tells me that while movements in the long bond as well as shifts in the Treasury yield curve are important, they are not the key drivers they were in 2022.
Treasuries Usually Rally After The Final Rate Hike
J.P. Morgan Asset Management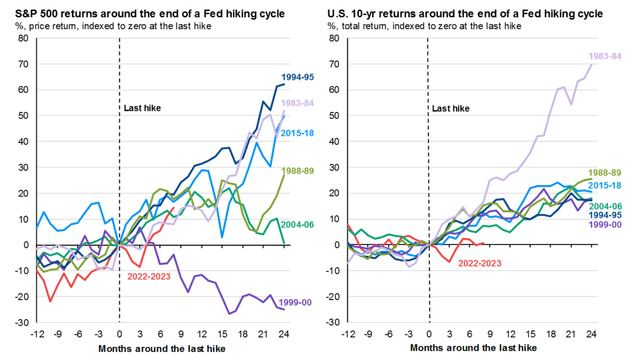
What could also work to suppress rates is the reality that if policymakers allow yields to get out of control to the upside, then debt servicing costs will become prohibitively high. Bank of America Global Research pointed out recently that the Fed might have to cost-control interest rates to prevent turmoil in not only the bond market but also financial markets around the world.
Keeping A Lid On Rates: Interest Costs Mounting
BofA Global Research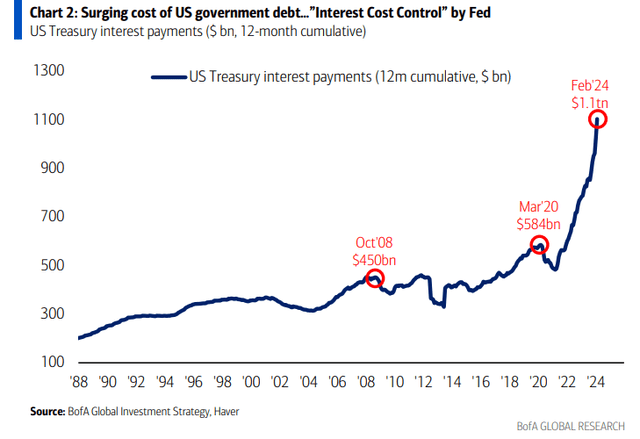
Also keep in mind that there is more than $6 trillion in cash housed within money market mutual funds, partly as a byproduct of the rate-hike cycle that began more than two years ago. While not a vast sum compared to the value of global equities, it remains a sizable amount of dry powder that may eventually find its way into riskier areas, including long-term Treasury securities.
Cash On The Sidelines Could Put A Bid To The Long Bond
Apollo Global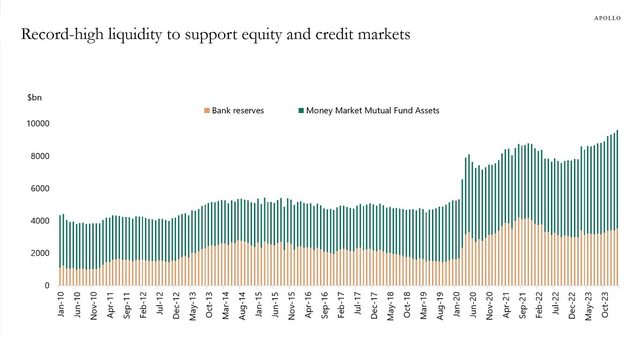
With mixed macro dynamics, seasonality on TLT is rather lukewarm from now through August. This further underscores a ‘stand on the sidelines’ approach through the second quarter and possibly beyond.
TLT: Neutral Seasonal Trends Through August
Seeking Alpha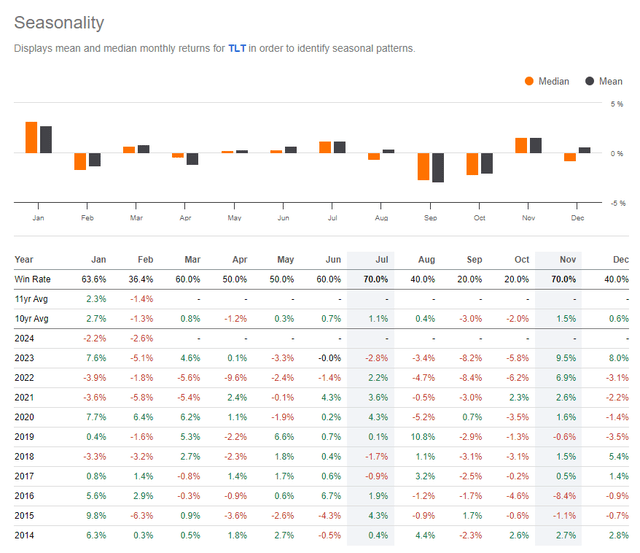
The Technical Take
With interest rates seemingly rangebound and neutral seasonality ahead, TLT’s technical chart is not exactly bullish. If anything, being short on a momentum basis could make sense. Notice in the chart below that the ETF remains mired in a bear market that began some 44 months ago – easily the longest drawdown in the aggregate bond market’s history (dating back to 1976).
For now, I see a downtrend resistance line that currently comes into play at the $98 mark. A breakout above that could portend a measure move upside price target of about $116, which would have some confluence with the consolidation from May through July 2022.
But with a downward-sloping long-term 200-day moving average and RSI momentum that is merely consolidating, the onus is on the bulls to reverse the pronounced downtrend. What’s more, there is a high amount of volume by price from $90 to $108 which could prove to be a battleground between the bulls and the bears over the months ahead.
Overall, TLT’s chart leans bearish with key support near $92.
TLT: Bearish Downtrend In Place, RSI Consolidating
Stockcharts.com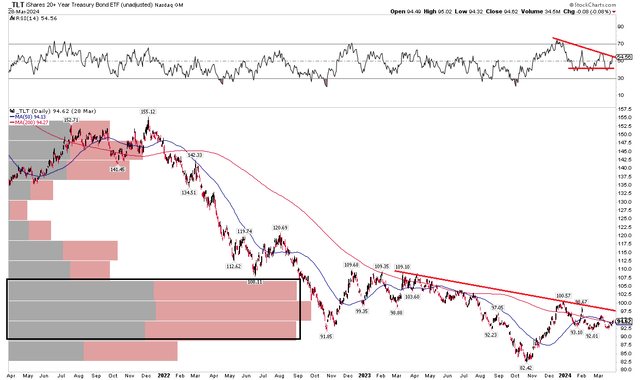
The Bottom Line
I have a hold rating on TLT. Amid mixed macro factors, including a Fed that now appears poised to begin a rate-cutting cycle while the AI theme likely warrants a higher neutral rate, I see an ongoing scuffle between long bond bulls and bears.
Read the full article here


