Earnings of Pacific Premier Bancorp, Inc. (NASDAQ:PPBI) will most likely dip this year because both the average loan balance and the average margin will be lower this year relative to last year. I’m expecting the company to report earnings of $2.56 per share for 2023, down 14% year-over-year. The year-end target price suggests a very high upside from the current market price. Further, Pacific Premier is offering a very high dividend yield of over 7%. Unfortunately, the company’s risk level is also high. Considering these factors, I’m adopting a Buy rating on Pacific Premier Bancorp.
Loan Trend Likely to Turn Positive but Remain Close to Zero
The declining loan trend that started in the third quarter of 2022 worsened during the first quarter of 2023. The loan portfolio declined by 3.5% during the first quarter as originations were unable to keep up with pay downs and payoffs. There is another $1.3 billion of scheduled loan paydowns for the last three quarters of 2023, as mentioned in the conference call. To put this number in perspective, $1.3 billion is a sizable 9% of total loans outstanding at the end of March 2023. Therefore, these paydowns will continue to exert pressure on the total loan portfolio size.
Further, funding constraints amid a declining deposit trend can also restrict loan growth. Pacific Premier is headquartered in California, which has seen deposit runs that tanked SVB Financial (OTC:SIVBQ) and First Republic Bank (OTCPK:FRCB). Pacific Premier’s deposit decline was quite small during the first quarter, so I’m not worried that it will experience a full-fledged deposit run. However, it’s likely that deposit growth will remain under pressure, which will also hurt loan growth.
Moreover, the higher costs for borrowers amid the rising-rate environment will dampen credit demand in Pacific Premier Bancorp’s markets.
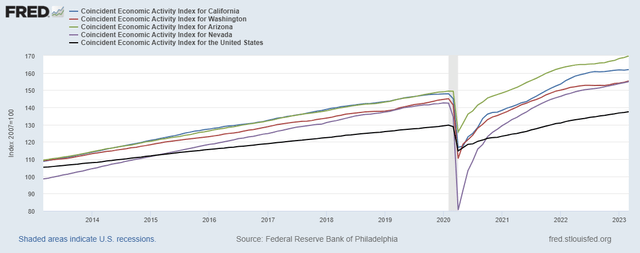
Nevertheless, I’m hopeful the declining loan trend will turn around because of strength in local markets. Pacific Premier operates in major metropolitan markets of California, Washington, Arizona, and Nevada. With the exception of California, all of the states Pacific Premier Bancorp operates in currently have steeper trend lines for economic activity than the national average.

The Federal Reserve Bank of Philadelphia
Considering these factors, I’m expecting the loan portfolio to grow by 0.5% in each of the last three quarters of 2023, leading to a full-year loan decline of 2%. The following table shows my balance sheet estimates.
| Financial Position | FY18 | FY19 | FY20 | FY21 | FY22 | FY23E |
| Net Loans | 8,801 | 8,687 | 12,968 | 14,098 | 14,481 | 14,187 |
| Growth of Net Loans | 42.7% | (1.3)% | 49.3% | 8.7% | 2.7% | (2.0)% |
| Other Earning Assets | 1,429 | 1,695 | 4,821 | 5,008 | 5,079 | 5,342 |
| Deposits | 8,658 | 8,899 | 16,214 | 17,116 | 17,352 | 17,467 |
| Borrowings and Sub-Debt | 778 | 732 | 533 | 889 | 1,331 | 1,148 |
| Common equity | 1,970 | 2,013 | 2,747 | 2,886 | 2,798 | 2,817 |
| Book Value Per Share ($) | 36.1 | 32.8 | 34.5 | 30.7 | 29.7 | 29.9 |
| Tangible BVPS ($) | 21.3 | 19.6 | 22.2 | 20.4 | 19.6 | 19.8 |
| Source: SEC Filings, Earnings Releases, Author’s Estimates(In USD million unless otherwise specified) | ||||||
Net Interest Margin Likely to Remain Stable
Pacific Premier’s net interest margin dipped by 17 basis points during the first quarter as the deposit mix has shifted towards higher-cost accounts over the past year. The proportion of non-interest-bearing deposits in total deposits dropped to 36.1% by the end of March 2023, from 40.2% on March 31, 2022. Management expects its clients to move further towards higher-yielding alternatives, as mentioned in the conference call. Therefore, it expects pressure to build on the net interest margin.
On the plus side, the addition of loans at higher rates will lift the average portfolio yield, and consequently the margin. The results of management’s rate sensitivity analysis given in the 10-Q filing show that a 200-basis points hike in rates could increase the net interest income by 5.8% over twelve months.

1Q 2023 10-Q Filing
Considering these factors, I’m expecting the margin to remain unchanged from the first quarter’s level. For the full-year, the average margin will be around 10 basis points lower than the average for last year.
Expecting Earnings to Dip by 14%
Earnings of Pacific Premier Bancorp will most probably be lower this year compared to last year because the average loan balance will be lower. The net interest margin will also be lower relative to last year because of the decline in the first quarter of the year. Additionally, inflation-driven growth in non-interest expenses will hurt earnings.
Overall, I’m expecting Pacific Premier to report earnings of $2.56 per share for 2023, down 14% year-over-year. The following table shows my income statement estimates.
| Income Statement | FY18 | FY19 | FY20 | FY21 | FY22 | FY23E |
| Net interest income | 393 | 447 | 574 | 662 | 697 | 674 |
| Provision for loan losses | 8 | 6 | 192 | (71) | 5 | 8 |
| Non-interest income | 31 | 35 | 71 | 108 | 89 | 82 |
| Non-interest expense | 250 | 259 | 381 | 380 | 397 | 418 |
| Net income – Common Sh. | 123 | 160 | 60 | 336 | 280 | 241 |
| EPS – Diluted ($) | 2.26 | 2.60 | 0.75 | 3.58 | 2.98 | 2.56 |
| Source: SEC Filings, Earnings Releases, Author’s Estimates(In USD million unless otherwise specified) | ||||||
Risks Appear High Due to the Location
The biggest source of risk for Pacific Premier Bancorp is its California location. The three U.S. banks that have failed so far, SVB Financial, First Republic Bank, and Signature Bank (OTC:SBNY), all had sizable exposure to California markets. The deposit runs that plagued SIVBQ and FRCB could also potentially spread to other banks in the area, including Pacific Premier Bancorp.
Apart from the contagion risk, the company’s risk level is satisfactory. Unlike other banks, Pacific Premier has NOT racked up large unrealized mark-to-market losses on its Available-for-Sale securities portfolio amid the rising rate environment. Gross unrealized losses totaled $253 million at the end of March 2023, which is around 9% of total equity. As 9% is a manageable level, these losses are not worrisome.
Moreover, uninsured and uncollateralized deposits made up 35% of total deposits at the end of March 2023, which isn’t too bad.
Overall, I believe Pacific Premier Bancorp’s risk level is high.
Dividend Yield of 7.4%, Over 27% Upside
Pacific Premier Bancorp’s stock price has plunged by 41% since March 8, 2023, when the Silvergate Capital (OTC:SICP) case sent ripples of panic across the banking sector. As a result of the price rout, Pacific Premier is now offering a very high dividend yield of 7.4% at the current quarterly dividend rate of $0.33 per share. The earnings estimate and current dividend imply a payout ratio of 52% for 2023, which is above the four-year (ex-2020) average of 42%, but still easily manageable. Therefore, I think the dividend is secure despite the earnings outlook.
I’m using the peer average price-to-tangible book (“P/TB”) and price-to-earnings (“P/E”) multiples to value Pacific Premier Bancorp. Peers are trading at an average P/TB ratio of 1.30 and an average P/E ratio of 7.79, as shown below.
| PPBI | FFBC | WAFD | AUB | PRK | FULT | Peer Average | |
| P/E (“ttm”) | 6.09 | 7.04 | 6.19 | 8.22 | 11.60 | 5.89 | 7.79 |
| P/E (“fwd”) | 7.38 | 6.70 | 6.38 | 9.43 | 12.45 | 5.98 | 8.19 |
| P/B (“ttm”) | 0.60 | 0.82 | 0.80 | 0.73 | 1.52 | 0.67 | 0.91 |
| P/TB (current) | 0.91 | 1.70 | 0.94 | 1.19 | 1.79 | 0.88 | 1.30 |
| Source: Seeking Alpha’s Peer Page for P/E and P/B, Charting Page for P/TB | |||||||
Multiplying the average P/TB multiple with the forecast tangible book value per share of $19.80 gives a target price of $25.70 for the end of 2023. This price target implies a 43.8% upside from the May 12 closing price. The following table shows the sensitivity of the target price to the P/TB ratio.
| P/TB Multiple | 1.10x | 1.20x | 1.30x | 1.40x | 1.50x |
| TBVPS – Dec 2023 ($) | 19.8 | 19.8 | 19.8 | 19.8 | 19.8 |
| Target Price ($) | 21.8 | 23.7 | 25.7 | 27.7 | 29.7 |
| Market Price ($) | 17.9 | 17.9 | 17.9 | 17.9 | 17.9 |
| Upside/(Downside) | 21.6% | 32.7% | 43.8% | 54.8% | 65.9% |
| Source: Author’s Estimates |
Multiplying the average P/E multiple with the forecast earnings per share of $2.56 gives a target price of $19.90 for the end of 2023. This price target implies an 11.3% upside from the May 12 closing price. The following table shows the sensitivity of the target price to the P/E ratio.
| P/E Multiple | 5.8x | 6.8x | 7.8x | 8.8x | 9.8x |
| EPS 2023 ($) | 2.56 | 2.56 | 2.56 | 2.56 | 2.56 |
| Target Price ($) | 14.8 | 17.4 | 19.9 | 22.5 | 25.0 |
| Market Price ($) | 17.9 | 17.9 | 17.9 | 17.9 | 17.9 |
| Upside/(Downside) | (17.3)% | (3.0)% | 11.3% | 25.6% | 39.9% |
| Source: Author’s Estimates |
Equally weighting the target prices from the two valuation methods gives a combined target price of $22.80, which implies a 27.5% upside from the current market price. Adding the forward dividend yield gives a total expected return of 34.9%.
I normally adopt a Strong Buy rating when the total expected return is this high. However, due to the risk level, I believe a Buy rating is more appropriate. Moreover, because of the riskiness, I believe Pacific Premier Bancorp is unsuitable for risk averse investors.
Read the full article here


