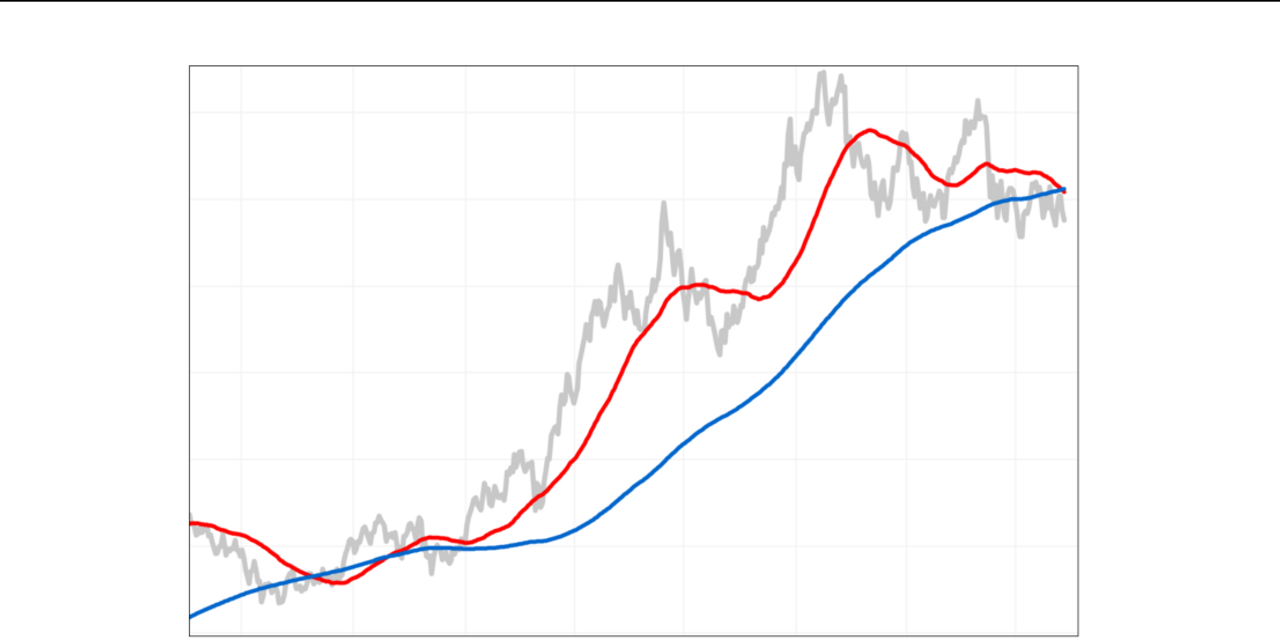
A bearish “death cross” has appeared in the daily chart of the 10-year Treasury yield, to reflect the end of the longest bullish stretch by one technical metric in more than 30 years.
And there’s reason to believe the yield will fall even further this year before the secular uptrend reasserts itself.
The 10-year yield
TMUBMUSD10Y,
fell by 0.042 percentage points Thursday to 3.397%, on the back of tamer-than-expected wholesale inflation data earlier in the session, and in-line consumer inflation data the previous sessions.
The yield decline comes as the 50-day moving average (DMA), which many on Wall Street use to track the short-term trend, crossed below the 200-DMA, which many view as a dividing line between longer- and short-term trends. Many chart watchers label that development as a “death cross,” to mark the spot a shorter-term pullback turns into a longer-term downtrend.
The death cross, which was confirmed at Wednesday’s close, snapped a 383-session stretch in which the 50-DMA was above the 200-DMA, which is the longest stretch seen since data from FactSet is available, going back to January 1994.
The yield has declined from a 14-year peak of 4.243% on Oct. 24, but was still more than double the yield of 1.157% on Oct. 29, 2021, when the 383-session streak started.
Death crosses, and the opposite “golden” crosses, aren’t meant to be good market timing signals, since they are well telegraphed, but they can provide some historical perspective on the length and breadth of a recent trend.
And while the 10-year yield’s death cross can provide a bearish backdrop, warning of further yield declines, the predictive prowess of previous death crosses has been spotty at best.
There have now been eight death crosses in the past 10 years. Of the past seven, three led to meaningful declines in yields, and lasted an average of 325 sessions before being canceled by a golden cross. The other four lasted an average of just 39 sessions, and three of them actually preceded increases in yields.
Technician Katie Stockton, founder and managing partner of Fairlead Strategies LLC, said while the latest death cross doesn’t necessarily portend a decisive downtrend, it reflects what she believes is a “cyclical down move” in yields that could characterize the trend for most of this year, before the previous new, longer-term uptrend reasserts itself.
“The assumption would be that the secular uptrend resumes,” eventually, Stockton said.
In the meantime, given some negative readings in some medium-term momentum indicators, Stockton believes the yield looks likely to break below technical support at the 3.25% level.
That leaves scope for the yield to fall to around 3.00%. If it does, she believes that would likely mark a “realistic low.”
Read the full article here


