Dear Partners & Friends,
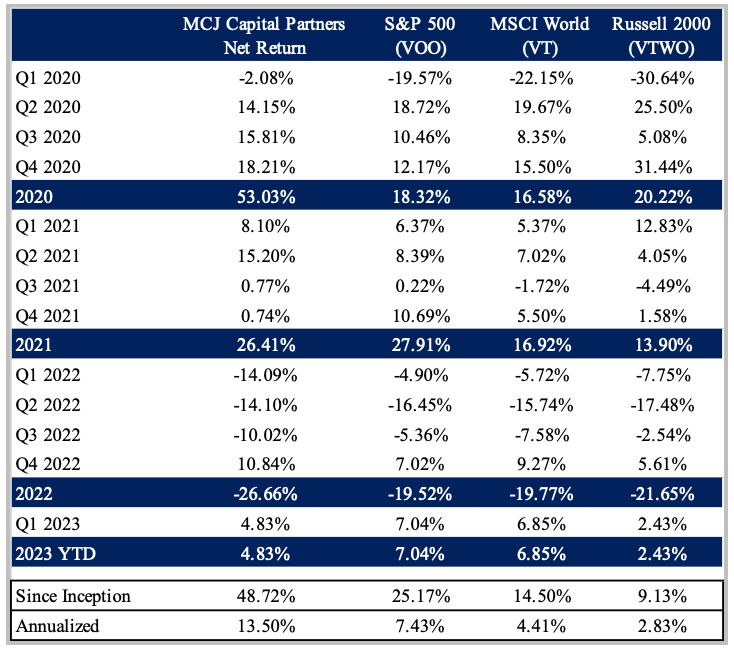
For Q1 of 2023 our total return was 4.83% compared to 7.04% for the broader S&P Index, 6.85% for the MSCI World index, and 2.43% for the Russell 2000 index.[1]
Since inception (as marked February 12, 2020), our total return is 48.72% compared to 25.17% for the broader S&P Index, 14.50% for the MSCI World index, and 9.13% for the Russell 2000 index.

Thoughts and Commentary on Q1 2023
There’s always something interesting happening in the world, and the first quarter of 2023 brought us escapades of a mini banking crisis that toppled Silicon Valley Bank, Signature Bank (OTC:SBNY), and Credit Suisse (CS). Over a single weekend, it seemed everyone in the world of finance became an “expert” on banking. It also left the average American rightfully asking, “what is FDIC insurance and how does it actually work?” Aside from banking the narrative has shifted from worries regarding inflation to worries about a slowing economy. Even with a teasingly low unemployment rate, persistent headlines of workforce cuts are starting to add up. If unemployment breaks to the high side, the real question will be what happens to housing?
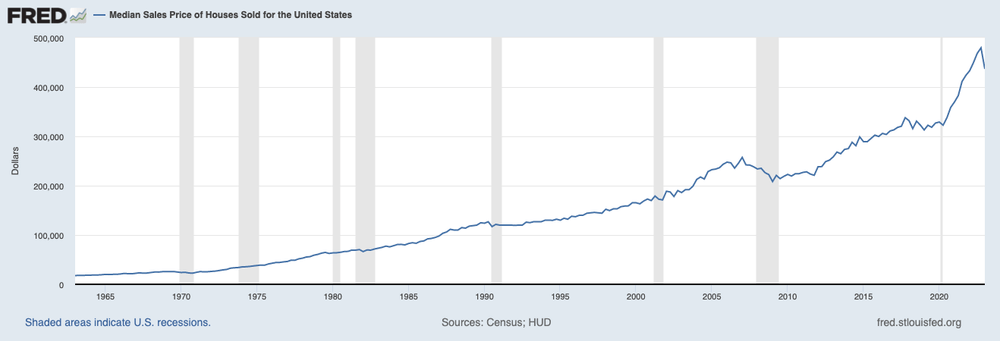
Consider for a moment that since 2010, the Median Sales Price of Houses Sold has risen 96% from $222,900 to $436,800 (down from the recent peak of $479,500).[2] And yet, over this same period, the Median Household Income has risen roughly 50% from $49,276 to an approximate $74,323.[3] This translates to the Median U.S. Household paying approximately 39% of each paycheck towards the mortgage on today’s purchase of a house (assuming a 20% down payment and at current 30-year fixed mortgage rates). The Federal Reserve has a classification for this, it’s called “Burdened Households” and is defined as households with a mortgage that exceeds 30% of income.

Using a slightly different methodology to think it all through, the Case-Shiller U.S. Home Price Index shows that home prices to median income stand at a staggering 7.54 ratio, slightly down from the historical high set just last year of 7.76. To add perspective, between 1967 and 2001 this ratio never exceeded 5.10. At the peak of the housing bubble that led to the Great Financial Crises of 2007/2008, the ratio topped out at 7.03.
To be clear I’m not predicting a collapse in American housing. I’m just stating things could get interesting if the labor market softens. Remember, housing contributes to roughly 17% of GDP, making it an important driver of the economy. During the GFC it took overheated markets three years to work off a 50% price “correction.” It’s taken one quarter (or approximately three months) for the current Median Sales Price of Houses Sold to slip 8.9% from the peak. In comparison, during the GFC that same fate took well over a year.
Transitioning to a topic closer to our portfolio…

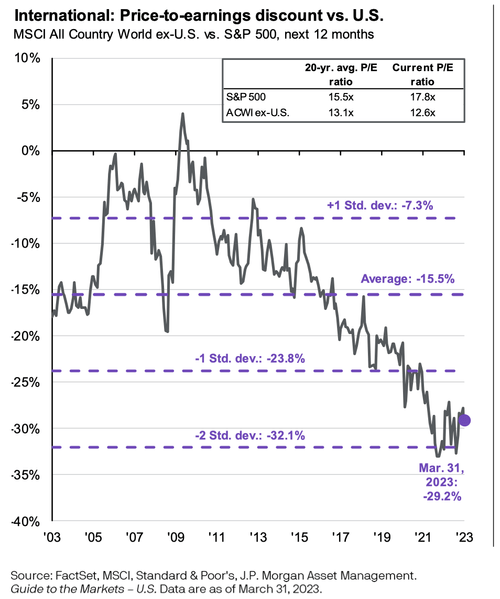
J.P. Morgan releases a quarterly “Guide to the Markets.” It’s always filled with interesting data and benchmarks. The most recent to catch my eye was the continued persistent discount of international equities to their U.S. counterparts. Currently, the price to earnings discount of the MSCI All Country World (excluding the U.S.) compared to the S&P 500 (SP500) sits at roughly two standard deviations of its 20-year historical average. Keep in mind the U.S. dollar remains elevated in a historical context, even after giving up ground recently. Yes, international equities could always get cheaper, and the U.S. dollar could continue growing stronger. However, given the conditions, I like how we’re positioned. The majority of our portfolio is currently in companies trading outside of the U.S. This wasn’t an intentional factor call on my part. It was simply the byproduct of trying to find good businesses at reasonable prices. We’ll go to where the opportunities present themselves.
The Joys of Learning As It Relates To Business Models
One of the perks of investing is the constant opportunity to learn. Perhaps my favorite activity of study is dissecting and accumulating an understanding of different business models. The way my mind works, building a circle of competence around a business model (as opposed to just an industry) intuitively makes more sense. In a way, it removes constraints and connects different channels of the marketplace. It’s also appealing to know the knowledge accumulated around studying the correct business models comes with a long(er) shelf life and the versatility of being applicable across various industries. Take the business model of serial acquirers for example. Is it not fascinating to think the model that worked for Bergman and Beving in 1906 or Illinois Tool Works (ITW) in 1912, was further mastered by Henry Singleton’s Teledyne (TDY) beginning in 1960 and still in 2023 works marvels for companies like our Constellation Software (OTCPK:CNSWF)? And the knowledge gained from understanding this business model isn’t confined to a single industry (although the model of serial acquirer works better in some industries than others). You can see the versatility of the model just in our portfolio. Kelly Partners Group Holdings (OTCPK:KPGHF) is executing the serial acquirer model within the industry of accounting. Judges Scientific is deploying the model within scientific instruments. And of course, Constellation Software has mastered the model in mission-critical vertical market software. The point worth emphasizing is that by prioritizing our learning of the right business models we create a circle of competence that has a longer shelf life and the ability to travel to different corners of the market assisting the freedom of an industry agnostic approach.
In this update, I want to share brief thoughts about the distributor business model. It’s a model I have yet to write much on but continue to grow in admiration for how it works. If you ask some, “Distributors” are their own industry altogether. However, I view it as a business model, found in various nooks and crannies all across the economy. Let’s jump into it…
What are distributors? Distributors are companies that buy products from manufacturers (or suppliers) and then sell those products to end customers. They often serve as crucial intermediaries in the supply chain, providing logistics, warehousing, and marketing services to help get products of the manufacturer to the end customer as efficiently and effectively as possible. Distributors are agile in the sense that their core offerings can switch in near real-time, as the demands of the market evolve. Contrast this with a manufacturer who may find their product obsolete and face permanent impairment if they are caught offside at any point of their product lifecycle.
Where do distributors thrive? There are certain corners of the marketplace that cast more favorable dynamics for distributors. For starters, distributors do well serving highly fragmented customer bases with low purchasing power. These customers ultimately have a need for an abundance of different products but purchase these products at low to moderate quantity intervals. If these products are sourced from a wide variety of manufacturers and suppliers, the relationship of the distributor as the middleman becomes even more valuable in the supply chain. This gives us a dynamic component to measure how well the distributor is growing. The function of total suppliers multiplied by total customers presents us with a power output of the network value. The position of the distributor strengthens further the greater the disbursement of the customer’s geographic proximity. Said differently, a distributor with 1,000 customers is more valuable if those customers are scattered across 50 countries versus isolated in just five countries. For sales processes that require a more personal approach or even an in-person touch, the value of a distributor deepens. When end customers are sprinkled across territories with different language and regulatory burdens, a competent distributor can find itself with a formidable moat in the marketplace.
What hurts a distributor? Like all businesses, distributors aren’t immune to the forces of the marketplace. The incumbent distributor finds itself not only in competition with other distributors but also under threat of being cannibalized by the products it peddles. The most direct threat to a distributor is when a manufacturer or supplier reaches a point of critical mass within the market that the distributor serves. At this point the manufacturer can set up a local shop, bypassing the needs of a distributor altogether. This can also be achieved by supplier consolidation. Overall, the moat of a distributor shrinks with each new territory that its supplier enters. While this is the main threat to a distributor, the end customers are also capable of a formidable attack. Remember, distributors thrive by serving customers with low purchasing power. Customers that band together to form purchasing groups (or join Group Purchasing Organizations), can not only put pricing pressure on the distributor but also bypass the distributor altogether if there is no logistical hurdle to the fulfillment process. In addition, distributors must battle moderate duration pricing risk. If suppliers increase prices and the distributor has fixed pricing contracts with customers, this can wreak havoc on margins.
How does a distributor play defense? Distributors understand these threats and the best have good countermeasures in place. To offset the threat of critical mass, distributors keep the number of suppliers in abundance, never letting the sales of a single product grow too high in concentration. If that doesn’t do the trick, distributors can remove the threat altogether by launching or acquiring the manufacturing functions of the product that is reaching critical mass. To counter pressure from customers forming purchasing groups, distributors can offer value add services like training and seminars. This positions the distributor as a crucial value add expert for their end customers as opposed to just a commoditized middleman. Perhaps most valuable, the distributor can build out infrastructure to deliver products faster to the end customer. This serves as a win in two functions as it’s less replicable by manufacturers and end customers while simultaneously strengthening the distributor’s position in comparison to other distributors. For duration pricing risk on contracts, distributors can leverage their surplus of market data pricing to account for supplier increases, or structure accelerators and other functions within the contract with customers that adjust the pricing risk.
The distributor business model passes my first test of longevity (and thus long shelf life for our accumulated knowledge). The model is timeless and well-proven across different historical periods. If you don’t believe me, take a look at Casa de Ganaderos of Spain. The company was founded in 1218 (five years removed from its 800th anniversary!) as a meat distributor and still operates today.
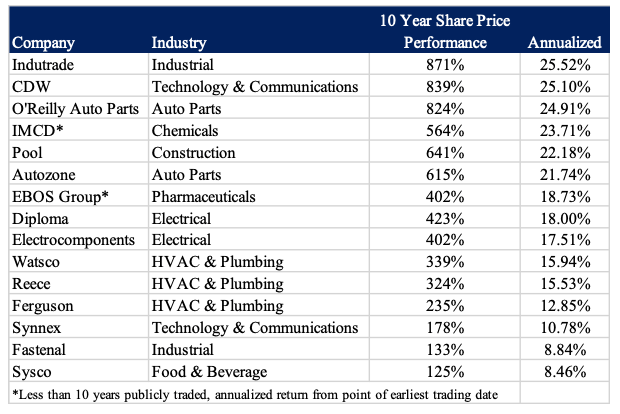
What I’m finding more fascinating is how well the distributor model passes my test of industry agility and transferability. Take a look at a few of the most popular distributors and their share price returns over the last 10 years:

Sure you can say I’m cherry-picking winners, but the point worth emphasizing is distributors have proven to work across an assortment of industries, offering long-term compounding under the right conditions. It’s evident to me, this is a good area to turn over more rocks.
If I’ve convinced you distributors are at least worth keeping an eye on, then hopefully you’ll be pleased to know we have some exposure already in our portfolio. For example, Lifco (OTCPK:LFABF) has a phenomenal dental distribution business. The entire dental business makes up roughly 25% of Lifco’s total sales. Since 2006, the entire dental business has grown the top line by 11.6% per year, proving its operating leverage with EBITA compounding 15.3% annually over that same period (half of which is attributable to organic growth). The distribution business within dental spans a total of 13 countries across the Nordics, Baltics, and other parts of Eastern Europe, and is the market leader in the Nordics and Germany. It provides a healthy mix of consumables and equipment, while also using the footprint to assist with adjacent market offerings of the portfolio for dental prosthetic and software lines of business.
Overall, the company plays the distribution model like a fiddle. It patiently waits for distribution acquisitions to surface in strategic outposts. It moves up the value chain for product lines that dance towards critical mass. It increases its offering with niche products relevant to its end customers. It operates and expands across territories with differing regulatory and language barriers, further deepening its overall moat. Year by year, the company spins its web, creating a stronger distribution business with powerful network effects.
In Closing
It’s been a busy but enjoyable start to the year. I’m consistently seeing more reasonable deals in private markets that also carry higher quality than what has transpired over the last few years. In addition, there are really good companies in the public markets flirting with areas of fair pricing. All this to say, there is plenty to dig into.
This time of year I’m greeted with the annual pilgrimage to Omaha for the Berkshire Hathaway festivities. It’s always a fun weekend that fosters a lot of learning, good times with old friends, and opportunities to meet new friends. If you plan on being in Omaha and would like to get together, please reach out. Alternatively, if you know anyone attending whom I should meet, please do let me know.
Lastly, as always I’m grateful for your trust in managing your capital. Having patient partners with alignment is a strategic advantage that allows us to pursue opportunities out of reach for others. Over time this advantage certainly compounds and I can’t emphasize enough the importance you play.
Until next time,
M. Carter Johnson

|
1) The performance results shown are those of the first account under management of MCJ Capital Partners LLC (“MCJ”) and are the result of the application of MCJ’s proprietary investment process. These performance results are presented net of all fees including brokerage, margin, custodial, and a 1% annual management fee beginning in January 2021. No management fee was charged in 2020, all other fees were present. A client’s return with respect to an investment would be reduced by any fees or expenses a client may incur in the management of its investment advisory account, including advisory fees in the future. The performance results include the reinvestment of dividends and interest on cash balances where applicable. All performance results are unaudited and are not an estimate of any specific investor’s actual performance, which may be materially different from such performance depending on numerous factors. No representations or warranties whatsoever are made by MCJ or any other person or entity as to the future profitability of an investment account or the results of making an investment. All information provided is for informational purposes only and should not be deemed as advice in relation to legal, taxation, or investment matters. Past performance is not indicative of future results. Each of the S&P 500 Index, the MSCI Index, and the Russell 2000 Index (each, an “Index”) is an unmanaged index of securities that is used as a general measure of market performance, and its performance is not reflective of the performance of any specific investment. The Index comparisons are provided for informational purposes only and should not be used as the basis for making an investment decision. Further, the performance of an account managed by MCJ and each Index may not be comparable. There may be significant differences between an account managed by MCJ and each Index, including, but not limited to, risk profile, liquidity, volatility and asset comparison. The performance shown for each Index reflects no deduction for client withdrawals, fees or expenses. Accordingly, comparisons against the Index may be of limited use. Investments cannot be made directly into an Index. The S&P Index return was determined using the performance of Vanguard S&P 500 ETF (VOO). The MSCI Index return was determined using the performance of Vanguard Total World Stock ETF (VT). The Russell 2000 Index return was determined using the performance of Vanguard Russell 2000 ETF (VTWO). All data for VOO, VT and VTWO are derived from Yahoo Finance Historical Data. MCJ offers investment advisory services and is registered with the state of Colorado. Registration does not constitute an endorsement of the advisory firm by the Colorado Securities Commissioner nor does it indicate that the advisory firm has attained a particular level of skill or ability. All content on this webpage is general in nature, not directed or tailored to any particular person, and is for informational purposes only. Neither this webpage nor its contents are offered as investment advice and should not be deemed as investment advice or a recommendation to purchase or sell any specific security. In addition, neither this webpage nor its contents should be construed as legal, tax, or other advice. Individuals are urged to consult with their own tax or legal advisers before entering into any advisory contract. The information contained herein reflects the current expectations and opinions of MCJ as of the date of publication, which are subject to change without notice at any time. MCJ does not represent that any expectation or opinion will be realized. While the information presented herein is believed to be reliable, no representation or warranty is made concerning the accuracy of any data presented. Neither MCJ nor any of its advisers, officers, directors, or affiliates represents that the information presented in this tear sheet is accurate, current or complete, and such information is subject to change without notice. No representations or warranties whatsoever are made by MCJ or any other person or entity as to the future profitability of an investment account or the results of making an investment. Past performance is not indicative of future results. Additional information is available from MCJ upon request. MCJ is not acting as your adviser or agent unless and until you and MCJ sign an investment advisory agreement. Readers are advised that the material herein should be used solely for educational purposes. This memorandum expresses the views of the author as of the date indicated and such views are subject to change without notice. MCJ Capital Partners LLC does not purport to tell or suggest which investment securities members or readers should buy or sell for themselves. Readers should always conduct their own research and due diligence and obtain professional advice before making any investment decision. MCJ Capital Partners LLC will not be liable for any loss or damage caused by a reader’s reliance on information obtained in any of our newsletters, presentations, memorandums, special reports, email correspondence, or on our website. Our readers are solely responsible for their own investment decisions. The information contained herein does not constitute a representation by the publisher or a solicitation for the purchase or sale of securities. Our opinions and analyses are based on sources believed to be reliable and are written in good faith, but no representation or warranty, expressed or implied, is made as to their accuracy or completeness. All information contained in our newsletters, presentations or on our website should be independently verified with the companies mentioned. The editor and publisher are not responsible for errors or omissions. MCJ Capital Partners and accounts actively managed by MCJ Capital Partners have long positions in Constellation Software, Judges Scientific plc, Kelly Partners Group Holdings , and Lifco and would benefit from overall price appreciation of the stock. At any time we may close these positions without notice. |
Original Post
Editor’s Note: The summary bullets for this article were chosen by Seeking Alpha editors.
Editor’s Note: This article discusses one or more securities that do not trade on a major U.S. exchange. Please be aware of the risks associated with these stocks.
Read the full article here


