A recession is when your neighbor loses his job. A depression is when you lose yours.” – Ronald Reagan
The problem with recessions is they are difficult to forecast, except after the fact. This is why the National Bureau of Economic Research or NBER usually doesn’t officially tag when a recession started until 6-12 months after it has commenced historically.
While hindsight may be 20/20, there are plenty of signs the country is already in a recession or is quickly going to enter one. Here are five economic signals I am watching that tell me we are in or on the verge of an economic contraction.
Manufacturing Has Slumped For A Year Now:
Monday’s September ISM Manufacturing PMI reading came in at 49. This was above expectations of 47.7. However, this is now the 11th straight month this reading has been below the 50 level, which marks expansion. While manufacturing is not as much an economic driver as it was generations ago, it is still important as it contributes approximately 12% of overall GDP.
Monthly U.S. PMI Readings (Trading Economics)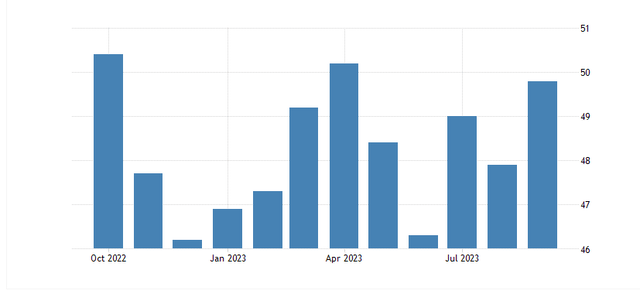
This metric could slump further if the UAW strike against the Big Three continues to escalate, which seems likely. In addition, manufacturing is in recessionary territory globally. Germany, the key manufacturing hub in Europe is being impacted substantially from higher energy prices due largely to sanctions on Russian energy. Its PMI reading for September, came in at 39.6, deep in recessionary territory. European PMI posted a 43.4 level for September.
The Consumer Is Cracking:
As I noted in my recent article ‘The Consumer Is Toast’, the American consumer is beset on myriad fronts. The excess savings built up during the Covid Pandemic and the congressional largess that event triggered, has not been spent.
JP Morgan Equity Macro Research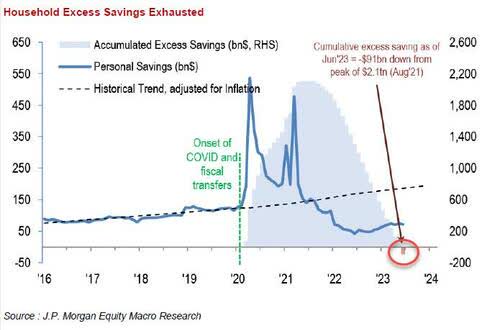
The Jobs market is also starting to deteriorate with full-time positions being lost in both July and August according to the Bureau of Labor Statistics or BLS and every monthly jobs numbers so far in 2023 has been revised down in subsequent BLS revisions.
Monthly BLS Jobs Revisions (Zero Hedge)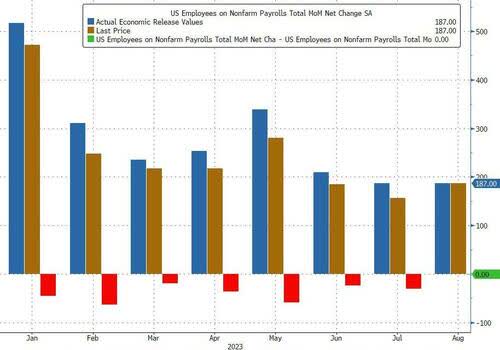
Credit card loss rates are going up faster than at any time since the Great Financial Crisis according to a recent report from Goldman and loss rates are expected to hit nearly five percent from the current 3.63% in 2024. That projection is likely conservative if the U.S. has a significant economic contraction.
WTI Oil Prices (Market Watch)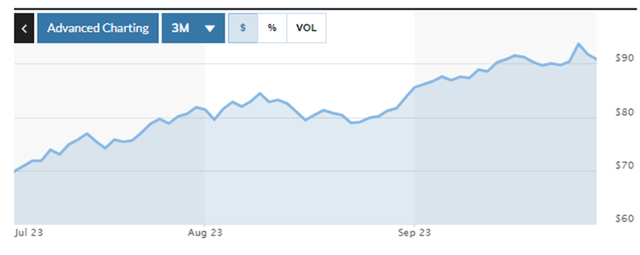
In addition, gasoline prices rose sharply in the third quarter as the price of WTI oil went from $70 a barrel at the start of the quarter to close above $90 a barrel at the close of the quarter. Finally, student loan debt repayments start again this month after a three-year taxpayer subsidized hiatus.
It is hard to see how the consumer does not pull back substantially in the months ahead. Given the consumer makes up nearly 70% of economic activity, how does the economy expand if the consumer is contracting?
The S&P 500 Has Peaked:
Zero Hedge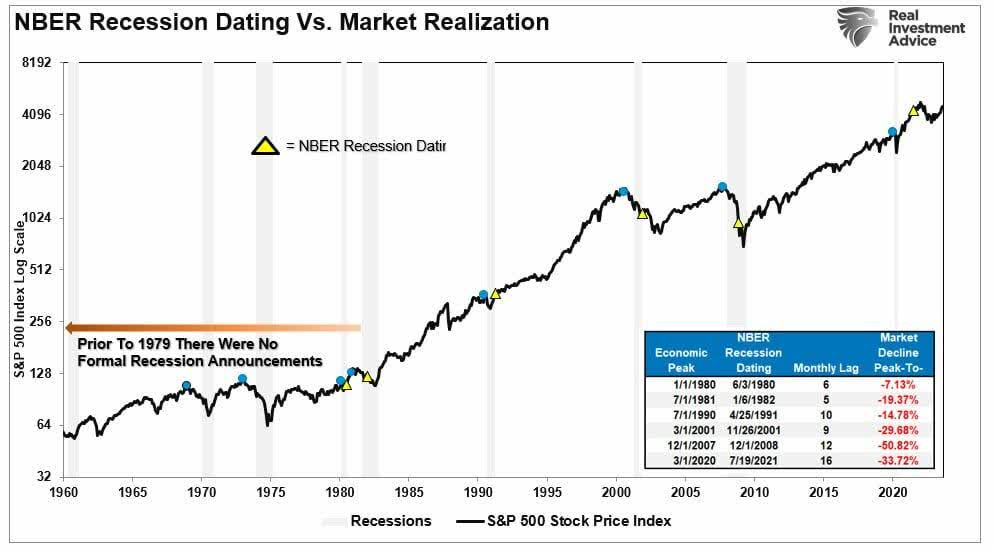
The S&P 500 has peaked in front of 9 of the last 10 recession the NBER has eventually called. This index reached a recent peak of just over 4,575 at the end of July and has had an over six percent decline since.
MarketWatch
With the 10-Year Treasury yield closing in on 4.7% and continuing to rise, it is hard to see how the index gets back to its previous glory. A recent article did a nice job noting how valuations on the S&P 500 are stretched, downward earnings revisions in 2024 are likely and how a potential ‘credit crunch’ could develop in the year ahead. It concluded with a projection that the S&P 500 is likely to head significantly lower. A view I concur with at the moment.
Corporate Profit Growth Is Negative:
One of the keys to an economic expansion is corporate profit growth. Rising profits make it more likely companies will continue to expand their capacity and their capital expenditures. Rising earnings allows firms to give their employees raises and pay for things like business travel and new equipment. All of this is part of a virtual circle that supports further economic growth.
However, when corporate earnings decline, everything reverses. The previous virtual circle becomes a vicious one. As corporations focus on improving margins to maintain profits, layoffs accelerate and things like employing training and bonuses get cut, undermining the larger economy.
Unfortunately, there is no growth in corporate profits so far in 2023. In fact, they are negative territory for the first six months of the year. Monday morning it was reported that Q2 corporate profits rose just .5% compared to expectations of 1.6%. Q1 corporate profits were revised up from a negative 5.9% to a negative 4.1%. So, for the first half of 2023, corporate profits fell nearly two percent. Hardly something one would expect to see with ‘official‘ GDP growth for the first half of the year at just over 2%.
Leading Economic Indicators Continue To Point Down
The Leading Economic Indicators or LEI continue to point to a recession on a horizon. They have been in negative territory for 17 straight months now, the longest such streak since 2007/2008 right before the Great Financial Crisis. Most investors continue to ignore this indicator as it has been negative territory for almost a year and a half, and no recession has arrived yet. They are doing the same with the yield curve which has been inverted since early last summer.
U.S. Monthly Leading Economic Indicators (The Conference Board)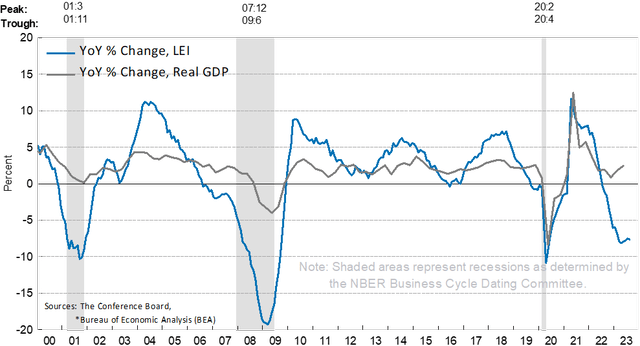
Investors are doing so at their peril. It is important to note, both these readings historically have had long lags before recessions appear, but both have been very accurate predicting economic contractions since WWII. The LEI did not start falling until the middle of 2006 it should be noted. Just over two years before the Lehman Event in September of 2008 that helped define the Great Financial recession.
Federal Reserve off St. Louis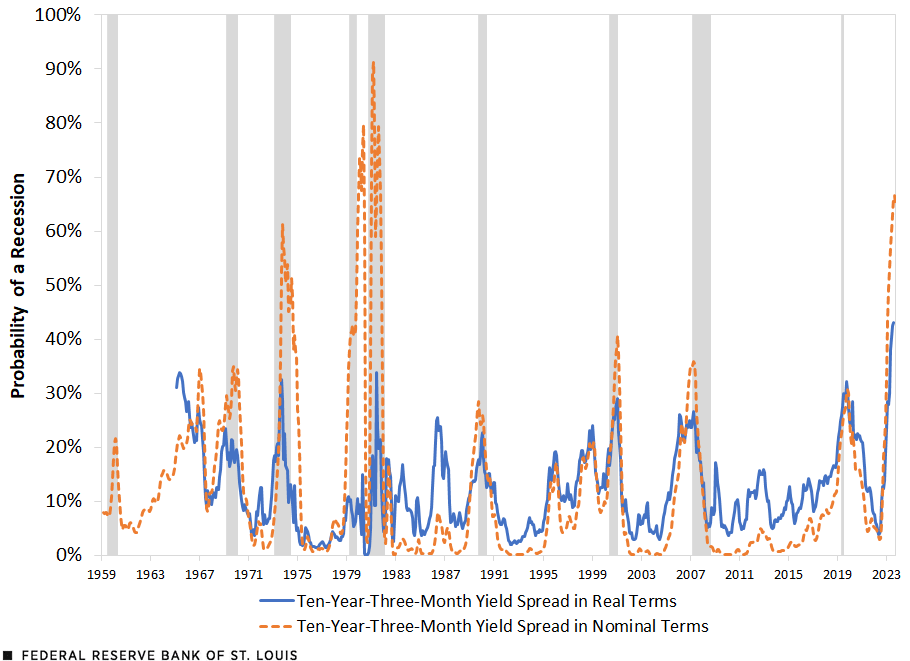
Inversion between the three month and 10-Year Treasury yield has predicted every recession since 1950s, albeit there were a couple of false positives in the late 60s and late 90s. The current inversion is predicting a 65% chance of recession in the next 12 months according to this article in September.
Portfolio Strategy:
Given my outlook that we are already in or on the cusp of an economic contraction, perhaps a significant one, my portfolio is obviously positioned very conservatively at the moment, and it gained just over two percent in the third quarter even as the major indices had their poorest quarterly performance in the third quarter since Q3 of last year. As I outlined in my article yesterday ‘More Pain Ahead’, here is my current portfolio allocation.
Portfolio Allocation:
Short-term treasuries – 50%
Covered Call Holdings – 40%
Cash – 6% to 7%
Long dated, out of the money bear put spreads mainly against the SPDR S&P 500 ETF Trust (SPY) and the Invesco QQQ Trust ETF (QQQ) – 3% to 4%
Not the most exciting portfolio configuration, but one that should withstand the storm on the horizon well.
You cannot spend your way out of recession or borrow your way out of debt.” -Daniel Hannan
Read the full article here


