Last week’s article called for higher, but the extent of this week’s move is surprising. The S&P 500 (SPY) blasted through 4400 to a Friday peak of 4448 as the Fed finally paused.
Never mind that a pause was almost completely expected, never mind that the FOMC projected two further hikes instead of just one – former bears turned bullish and had to chase the rally at any price. But, how long can this continue? Is the S&P500 making a blow off top?
To answer these questions, a variety of technical analysis techniques will be applied to the S&P 500 in multiple timeframes. The aim is to provide an actionable guide with directional bias, important levels and expectations for price action. I will then use the evidence to make a call for the week ahead.
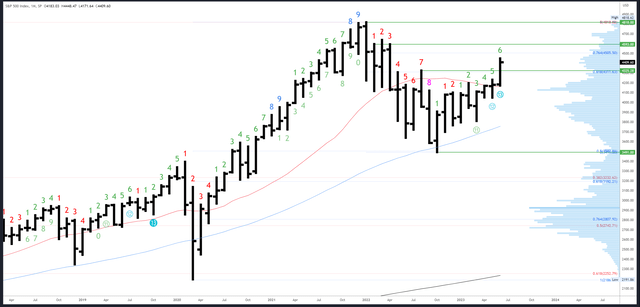
S&P 500 Monthly
The June bar keeps on rising and is through 4325 resistance. 4325 should now hold for a bullish bias and a close back below would be a negative sign.
SPX Monthly (Tradingview)
There is minor resistance at the 76.4% Fib at 4505, followed by monthly references starting at 4593.
4325 is potential support, then 4230 at last month’s high, with 4195-200 a major level just below.
An upside Demark exhaustion count is on bar 6 (of 9).
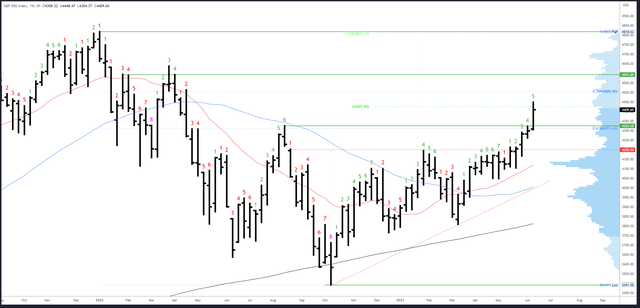
S&P 500 Weekly
This week’s pattern is similar to last week’s as a new weekly high was made on Friday but faded. Again, as the close was well off the weekly high, we can’t expect any immediate (i.e. on Tuesday) follow through above 4448.
While the weekly bar is bullish and any reversal pattern ideally needs a higher high, we can’t rule anything out after such a large rally. The bar is actually very similar to the one created in the week starting the 30th January, and we can see that back then the rally rolled over into a large correction. This is something to monitor in the coming weeks if new highs are not made.
SPX Weekly (Tradingview)
4505-4512 is the next resistance.
4322-25 is now initial support.
An upside (Demark) exhaustion count will be on bar 6 (of 9) next week.
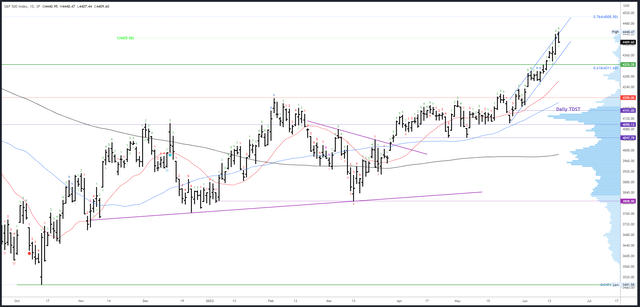
S&P 500 Daily
The daily Demark exhaustion failed after only a one bar reaction. With such a strong move higher, it seems either a second count or the higher timeframes need to line up before any substantial effect will be seen.
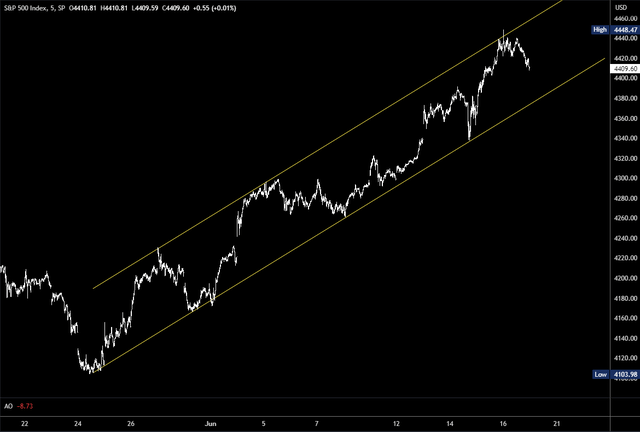
A clear trend channel has held since the 24th May low and this marked both Wednesday’s low and Friday’s high. This is best viewed on an intraday chart –
Intraday SPX (Tradingview)
Friday’s bar created a decent looking reversal as the gap up was sold aggressively and the session closed right on the lows. Follow through to the downside is therefore expected on Tuesday’s re-open and this should test the channel again at 4375-80.
SPX Daily (Tradingview)
Resistance is at 4505 from the weekly chart.
As mentioned earlier, the channel lows around 4375 are the first significant support level. There are also various minor supports created during last week’s rally, with Thursday’s 4362 low (the start of the large rally) and 4337 potential areas of interest.
A new upside exhaustion (Demark) will be on bar 7 on Tuesday and could prompt a reaction from Wednesday onwards should new highs be made.
Events Next Week
Markets are closed on Monday for the Juneteenth holiday.
No top tier data is scheduled for release next week. The main events are the various FOMC speeches and Chair Powell’s testimony on the Semi-Annual Monetary Policy Report on Wednesday and Thursday.
The equity rally ignored the hawkish backdrop last week. Two hikes instead of just one were projected in the FOMC dot plots, and it seems stock buyers either doubt the Fed will hike again, or don’t yet care. Certainly the pause in June was an odd decision if hikes are likely in July and August, but it may have something to do with liquidity issues in the wake of the debt ceiling deal. Bond markets have already priced in 17bps of tightening in July and Powell et al could make it even more certain next week.
Probable Moves Next Week
The S&P500 is overextended as traders chased the rally and bought at any price despite hawkish signals. Friday’s move signaled what should be the start of a move to flush these late buyers out. Weakness is expected on Tuesday for at least a move below Friday’s 4407 low to around 4375-80 and the channel lows. This is test for momentum, but not necessarily key to the whole trend. As the channel low has already had four touches, I’d expect a small bounce followed by a break lower to 4325-37 late in the week. 4325 is a key inflection level and needs to hold to maintain the bullish bias.
Due to the lack of higher timeframe exhaustion or signs of reversal, I think any dip next week is likely a reaction to overextension rather than the start of a major downswing. A move to 4325 would undo the entire post-FOMC rally and put every ‘Fed pause’ buyer underwater. Once this is achieved, the trend can rebuild.
Closing next week below 4325 level would suggest a larger swing down is underway and can target 4130, perhaps lower.
Read the full article here


