There are two stages for investors. The first is the accumulation phase, during which you save, accumulate, and grow your capital. The other one is after retirement, when you start withdrawing income (or capital) from your already accumulated capital. Both stages have their unique challenges.
Retirees, by the very definition, need to be or should plan to be financially independent. The other group, who is still in the accumulation phase, should work on being financially independent as it is a great stress-reducer. Being financially independent does not necessarily mean F.I.R.E. (Financially Independent, Retire Early). Not everyone wants to retire in their 40s. Also, being financially independent only means having the capacity to generate enough income to afford your basic necessities. It does not include luxuries, and other wants that you may have. For some folks, being financially independent only means they do not have to worry about the next layoff at the workplace. For others, it may mean having choices to live life on their own terms. But most folks should still work for a living to consolidate their gains and secure a wealthy retirement.
To be financially independent, you must have enough income (or the capacity to generate) that could meet most of your basic needs or essential living expenses. Obviously, you will need to separate your “wants” from your “needs.” Also, the more you can save, and early you save and invest, the sooner you can reach your goals of being financially independent.
To be financially independent, you should develop a strategy that should meet the following goals:
- Produce sufficiently high income (or have the capacity to generate) to meet basic needs;
- Avoid deep drawdowns and preserve capital during tough times (relatively speaking);
- Provide reasonably high growth for long-term wealth preservation.
Note: In our view, the strategies presented in this article are highly relevant in the current market environment. Our regular readers who like these strategies should benefit from this article with some new ideas and updated information. Further, we think new readers would possibly benefit greatly from these ideas. Thanks for reading.
Capital Preservation
There’s almost no financial investment that can preserve the capital 100% of the time or in all situations. Even if you were to keep your money in cash, you would lose to inflation over time. It is easy to see what inflation does to cash over a couple of decades. A real test of a strategy becomes clear during a crisis or a period of high stress, for example, the 2008-2009 financial crisis or during the 2020 pandemic. We also recommend that every investor should have a fairly good idea of his/her tolerance for volatility and drawdowns.
Preservation of capital (at least on a relative basis) is important at any age, more so for older investors. So, our portfolio should be able to achieve much lower volatility and smaller drawdowns than the broader indexes while not compromising on growth during good times.
Income
How much income would you need to be financially free? Obviously, it depends upon your personal situation, your total investment assets, and your individual lifestyle. That said, it depends upon your basic needs and living expenses. If you could lower your expenses, your need for income also gets reduced accordingly.
Percentage Yield required = 100 * (Yearly Expenses / Size of Assets)
In the above formula, retirees getting social security, pension, or any other fixed income should reduce their yearly expenses by the amount of such fixed income.
For example, let’s assume a retired couple needs a total of $85,000 annually to support their lifestyle, but they also get $50,000 in social security/pension income. In their situation, they only need to generate $35,000 of income from their investment assets. If their investment assets are $750,000, the yield requirement would be:
Percentage Yield required = 100 * ((85,000 – 50,000) / 750,000)
= 4.67%
It’s our belief that any portfolio that claims to (or aims to) produce more than 8% income would at least have some risk of depleting the capital unless you reinvest the income. It would certainly be very difficult to grow such a portfolio if the entire income is withdrawn. So, for these reasons, we would put the red line at 6% (for withdrawals).
Reasonable Growth
In the early stage of your working career and investment journey, you need to focus on savings and growing those savings rapidly. Since you have time on your side, your focus should be to let savings compound over time. However, we should focus on investing and avoid speculation. So, what is the reasonable rate of growth? Obviously, the definition would vary from person to person. But assuming a 3% inflation rate (provided the current high inflation subsides), a long-term growth rate of 9% to 10% would be reasonable. This would be enough to compound your capital over a few decades.
Sure, we want a high rate of growth during the early stages of capital building. So, it should be worthwhile to allocate a portion of your portfolio to high-growth stocks. We will cover one such strategy in this article.
Investment Strategy
In this article, we present a multi-basket strategy that attempts to meet most of the above goals. As such, besides growth, we focus on income-producing strategies that also preserve capital during times of crisis.
We will review our multi-basket strategy, that’s not overly complicated and easy to get started. Moreover, we should be able to leave the majority of our portfolio on the auto-pilot. This is especially important for folks who are busy in their day jobs and cannot spare much time on a day-to-day basis. We will provide as many as five sub-strategies (or buckets), but as an individual, you could do fine by picking and mixing up to three sub-strategies. We also will provide some back-testing examples for each sub-strategy and how they would have behaved during the 2020 crisis or during the 2008-09 financial crisis.
Please note that we manage most of these strategies/portfolios in our Marketplace service, which has live performance records at least since 2018 and for some limited portfolios since 2014.
Multi-Basket Strategies That Can Make You Financially Independent
We are going to discuss multiple strategies with unique goals and objectives in this article. However, we recommend you follow a multi-basket approach that uses a combination of at least three sub-strategies.
DGI Basket 1:
Allocation: 35-50%
Whether you are a passive investor or an active investor, a DGI (dividend growth investing) sub-portfolio should make the foundation of your overall portfolio. Allocation to this portfolio can vary based on your personal situation, but we recommend a 35% to 50% allocation.
This strategy can be active if you like to invest in individual stocks. Alternatively, if you were a passive investor, you could choose to invest in some good DGI-type ETFs (Exchange Traded Funds).
Option-1: Individual DGI Stocks:
A DGI portfolio of individual stocks should hold at least 15 stocks at a minimum but could have more than 20 stocks. It can vary from person to person, but anything more than 20 stocks will be difficult to monitor and manage. One should be careful to choose stocks from many sectors and industry segments.
For our sample portfolio presented below, we will look for companies that are large-cap, blue-chip, relatively safe and have solid dividend records. We will try to select companies that are known to do well under different market conditions.
Please note that this list is presented for demonstration purposes only. Obviously, there can be many more stocks that could be equally appealing and qualified for our portfolio.
Stocks selected:
(LMT), (MAIN), (PEP), (CLX), (UL), (ENB), (TROW), (PRU), (ABBV), (JNJ), (MMM), (EFV), (NNN), (DEA), (HD), (MSFT), (AVGO), (VZ), (BTI), (NEE)
Table-1:
Author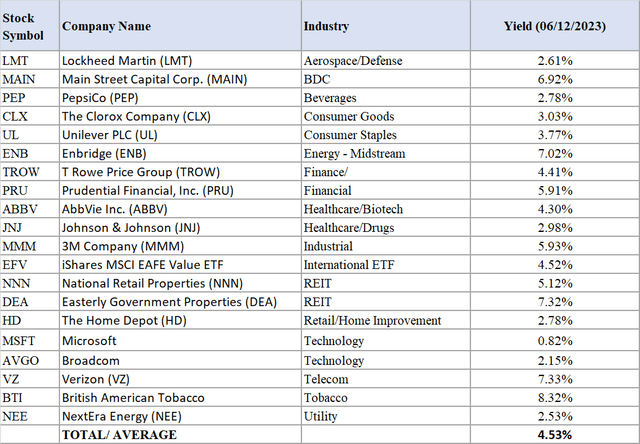
The average yield from this group of 20 stocks is very respectable at 4.5% compared to 1.50% from S&P 500.
Chart 1:
The chart below provides a performance comparison (back-tested) with the S&P500 from Jan. 2008 until June 12, 2023. As you can see, overall, the DGI portfolio outperformed the S&P 500 (SP500) over the last 15 years, with one-third less volatility.
Author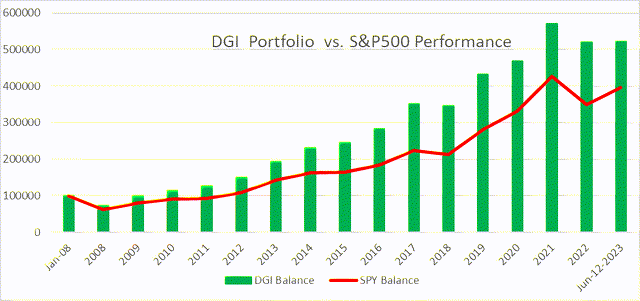
Note: For performance analysis back-testing, some of these stocks did not have a history as far back as 2008. They were replaced with appropriate substitutes; for example, ABBV was replaced with its parent co. ABT, prior to the year 2013 (prior to spinoff).
Option-2: DGI Basket With ETFs/Funds
This is an alternative DGI bucket for Passive investors who either do not have the time or the inclination to hold individual stocks. For such investors, we will present a portfolio of DGI ETFs that will provide more than enough diversification and reasonable income. Obviously, with ETFs, we will end up having some level of duplicity of holdings, but we should try to minimize it by selecting funds with different goals.
In this option, we will mix some low-cost ETF funds with a few high-yield closed-end funds. As per back-testing results, this portfolio should match the market performance by and large, but the distribution yield is more than double of the S&P 500.
Please note that we allocated 60% to relatively safe, low-cost dividend ETFs, while the rest of 40% to high-yield funds, including three closed-end funds (“CEFs”) and one energy partnership.
(VYM), (SCHD), (EFA), (QQQ), (GLD), (EPD), (PDI), (UTG), (BBN), (PFF).
Table 2: Dividend ETF/Funds (Moderately Aggressive):
Author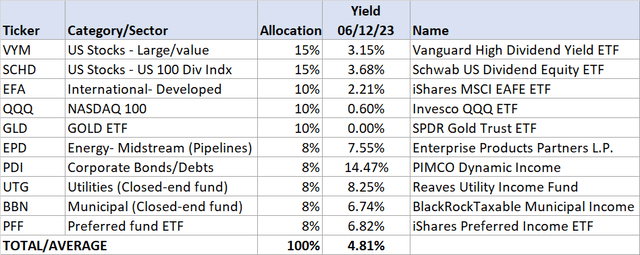
Notes:
Note: EPD is an Energy partnership. Please be aware that partnerships usually issue a K-1 statement for taxes instead of a 1099-div statement.
Rotational Risk-Adjusted Basket:
(Allocation 35% – 45%)
This is our hedging or insurance bucket. This bucket performs the best during the boom or outright bust years, though not so great in a stagnant (frequent up & down) market. There can be many such strategies; however, we are providing one such strategy. Also, even though the strategy described below does not generate income specifically, one can safely withdraw 5% to 6% of income on an annual basis. The reason one can safely draw income without depleting the capital is the relatively low volatility and limited drawdowns. We will see this in play in the charts provided below.
Please note that we are not suggesting that you should move a very large sum of money to these strategies overnight. Always start with a small amount and test the waters for a few months, especially if you are a new investor.
Multi-Funds Rotation Model
The portfolio is designed around multiple unrelated funds that may move in different directions at times. This provides an opportunity for the strategy to be in the asset that has a positive momentum and avoid assets that are not in favor. Also included are some hedging assets that should protect the downside. It does not always work, and at times, everything may perform badly, as was the case in the year 2022. Also, it may perform poorly in a situation when we witness frequent whipsaws in the market.
The strategy is based on SIX diverse securities but will hold only one of them at any given point in time, based on relative positive momentum over the previous three months. Rotation will be on a monthly basis.
Please note that there are two hedging assets, i.e., TLT and SHY, which are long-term and short-term Treasury funds. TLT may not work as a hedging asset always, but SHY should.
- Invesco QQQ Trust ETF (QQQ)
- SPDR S&P 500 ETF Trust (SPY)
- iShares 20+ Year Treasury ETF (TLT)
- iShares 1-3 Year Treasury ETF (SHY)
- John Hancock Dividend Income Fund (HTD)
- Tekla Life Sciences Investors (HQL)
The back-testing results are presented below, going back to the year 2008.
Growth Chart With No Income Withdrawals
Chart-2:
Author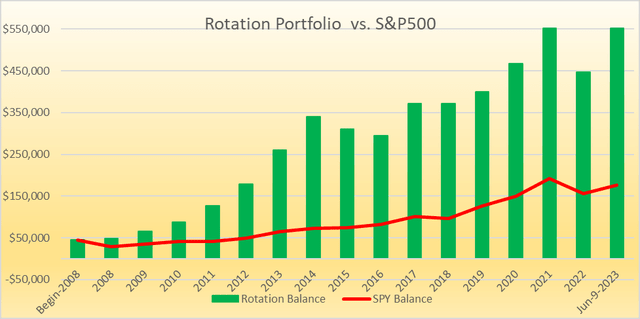
Growth Chart With 6% Income Withdrawals
The chart below is the same as above, except that yearly balances were calculated after subtracting the annual income withdrawals. This chart does an outstanding job of highlighting the stark contrast between the Rotation portfolio with low volatility and the S&P 500 (high volatility). A portfolio based on the S&P 500 will run the risk of losing capital due to sequential risk (the risk of sequential returns), while the Rotational portfolio manages it very well by avoiding deep drawdowns.
If you had invested 45,000 in Jan. 2008 in S&P 500 and withdrew an annual income of 6% (with 3% raise every year), you would be underwater after 15 years. However, the same amount invested in the Rotation strategy with similar withdrawals would have resulted in a balance of $445,000 today.
Chart-3:
Author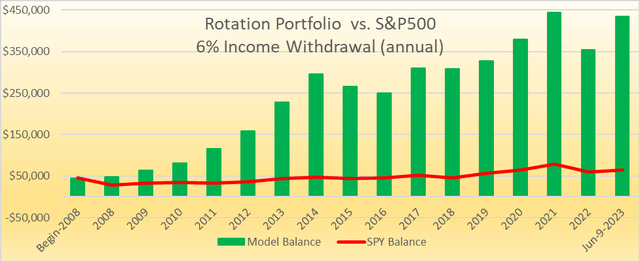
High-Income (8% Income) Basket:
(Maximum Allocation: 25%)
This basket is not for everyone. If you do not need income today or in the next 2 to 3 years, there may not be any need for this. However, if you need a high level of income today, it may be appropriate to consider this basket. Though we recommend a maximum allocation of up to 25%, we understand that everyone’s situation is different. Another advantage this basket can offer is that it can elevate the yield of the overall portfolio by 2-3% while taking a higher risk to a small portion of the capital.
In this basket, we would recommend having roughly ten funds, mostly closed-end funds. We could also mix a couple of BDCs (Business Development Co) and/or Energy partnerships. Obviously, we should try to select the best funds from each of the asset classes. Below are eleven funds that we have selected. In the energy midstream (pipelines) segment, we prefer individual partnership names like Magellan Midstream Partners (MMP) or Enterprise Products Partners (EPD) over a closed-end fund for this particular asset class.
These 11 funds are:
(CHI), (UTF), (UTG), (PDI), (BBN), (FFC), (BST), (THW), (EPD), (USA), (RQI).
Table-3:
Author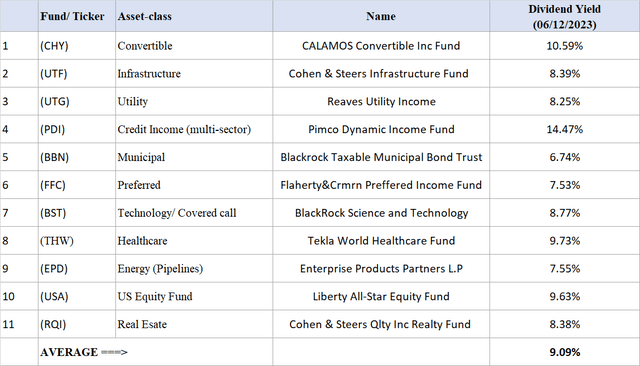
Note: EPD is an Energy partnership. Please be aware that partnerships usually issue a K-1 statement for taxes instead of a 1099-div statement.
Why is a CEF investment considered riskier?
The answer is, in a word, leverage. Most CEFs (not all) use 20% to 40% leverage to enhance income and yield. Obviously, leverage can work both ways. Further, normally, CEFs charge high management fees. After including the interests on leverage, it can amount to 2% to 3%, which can hurt the NAV. However, please note that you, as an investor, are not paying these fees separately. The NAV of a fund is calculated after accounting for fees.
We will now compare the relative performance of the CEF bucket vis-à-vis the S&P500. The period of comparison is over 15 years, from Jan. 2008 until May 2023. There were only a couple of funds that did not exist all the way; appropriate replacements were made for such a period.
Chart-4:
Author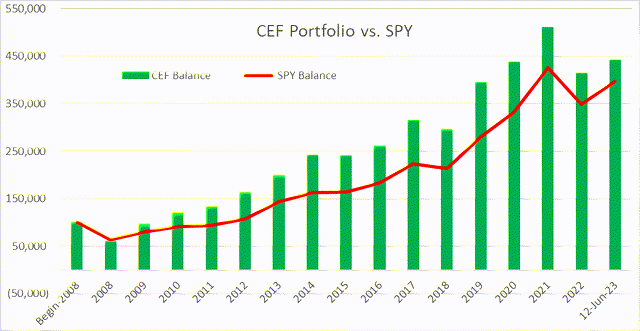
High-Income Bucket (Options-Income)
(Allocation: Max 25%)
This is a bucket that would require constant and regular work on a monthly or weekly basis. So, in that sense, this is one of the most active baskets, and that’s the reason it is not for everyone. Also, if you are new to Options, it does have a bit of a learning curve. Another minus is that the strategy requires a significant amount of capital if you want multiple open positions at the same time.
There are two types of Options, buying Options and Selling Options. We only like Selling options, as they are relatively safer. If you are new to options, we recommend reading some primers and a couple of good books on Options. You can also read our blog post here.
We also publish a monthly article here on the public Seeking Alpha forum. For the purpose of this section, we will assume that the reader is well-versed in how to write/sell cash-covered PUTs or CALL options.
In this bucket, we will sell some BUY-WRITE CALL options that would have an expiry of roughly one month or less. You can sell one contract or more, each contract representing 100 shares of the underlying stock.
For writing a BUY-WRITE CALL option, you would buy 100 shares of the underlying and sell the option (covered call) for one contract at the same time. You would pay the cost of 100 shares minus the premium you collect. If you already hold 100 shares of the underlying, you simply sell the covered call.
As diversification is important, it is recommended to use more than a few underlying stocks from different sectors/industry segments.
We are going to choose strike prices that are deep in the money (ITM or in-the-money). This will help us not only to earn high premiums but also to lower the cost of owning the stock in case the shares are not called away. Another added benefit is that there would be a very high probability that the majority of our options will be CALLED away. Remember, our primary purpose is to earn premiums (income).
A suggestive and sample list of trades is presented below:
Table-4:
Author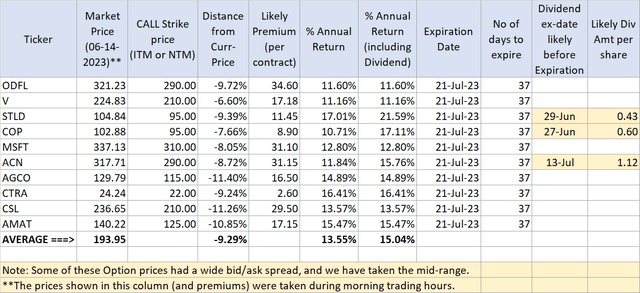
* Premium and prices as of 06/14/2023
Note: We would like to caution that you should be careful to pick underlying stocks. It is always possible that you may have to hold them for short to mid-term. If you are not in a position to hold them, it could result in significant loss and risk.
High Growth Bucket (No Income or Minimal Income)
(Allocation: 10% – 30%, depending upon age-bracket)
This bucket is for relatively younger folks who are in their 30s or early 40s. They could invest in high-growth stocks and sectors to grow their capital faster when they are still young. For older investors, there is definitely a place to invest in hi-tech or high-growth stocks, but the allocation should be limited. Also, it will depend upon the income needs of the investor since, usually, high-growth technology stocks provide no dividends.
All that said, you should choose high-growth investments rather carefully. There’s a difference between growth stocks and speculative ones. A high-growth stock in one year may turn out to be a dud next year, and so on. Also, please note that this bucket has no hedging mechanism, so it will likely have high drawdowns in case of a market correction. If you do not have tolerance for large drawdowns, it is better to stay away.
We would recommend the following method choosing a set of high-growth stocks at a given time and then repeating this process at least once a year.
-
- Market capitalization > $10 Billion (preferably > $20 Billion)
- Forward EPS (3-5 years) Growth Estimates > 10%
- EPS Growth (3-year history) > 7%.
- Revenue Growth (last three years) > 6%.
- Revenue growth current year vs. the previous year > 6%.
- Price-performance (52 weeks) > Price-performance-52-WK for S&P500 (or Nasdaq-100)
- Price-performance (13 weeks) > Price-performance-13-WK for S&P500 (or Nasdaq-100)
The above criteria can be adjusted higher or lower based on how many stocks come up in the filtered list.
As investor approaches retirement, they should gradually reduce exposure to this bucket and increase allocation to other buckets like DGI, Rotation bucket, and high-income securities (CEFs, REITs, BDCs).
How to attain Financial Freedom in 15 years using the multi-basket strategy?
Table-5: Structure of a Multi-Basket Portfolio
Author
Let’s assume you are 40 years old and have $150,000 saved so far. Though goals can vary from one individual to another, let’s assume that you will need $1.0 million to achieve financial freedom to cover your basic expenses. We are not talking about retirement goals, as you will probably need much more to retire comfortably, especially with a higher inflation environment. To achieve your financial freedom goal of $1 million, you will need to do both, save aggressively (at least 15% of your income) as well as achieve an average of 9-10% rate of return over the next 15 years.
But for the purpose of demonstration, let’s assume a conservative rate of growth at 8.5% on a yearly basis. Also, assuming your annual income is $100,000, here is the table that shows how you can achieve your goal in 15 years.
Table-6:
Author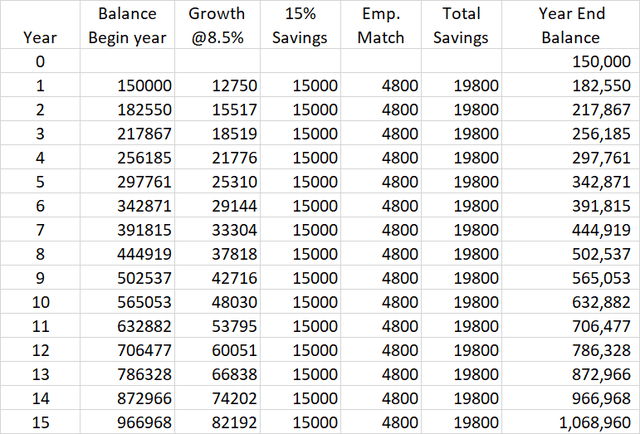
Concluding Thoughts
The boom-and-bust cycles have always been part of the market. However, due to Fed’s policies, they may have become more pronounced. In the last three years, at least thrice we had serious market declines. Obviously, the current situation is no different. The intent of this article was to present a variety of strategies that an investor could pick and choose to form an investment portfolio that offers less volatility and protects capital (resulting in less stress) but is not short on growth or income.
We have presented six different types of strategies. It is up to the individual investor what they like to pick and choose (at least three sub-portfolio). We certainly recommend a certain allocation to the Rotational bucket to provide the necessary hedge, lower volatility and drawdowns, and smooth out the returns.
Editor’s Note: This article discusses one or more securities that do not trade on a major U.S. exchange. Please be aware of the risks associated with these stocks.
Read the full article here


