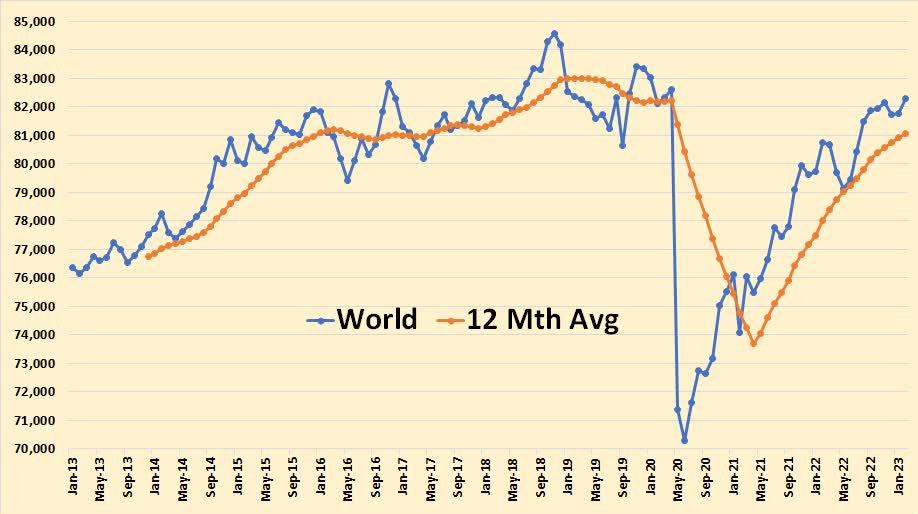
World C+C production increased by 524,000 barrels per day in February to a post-pandemic high.
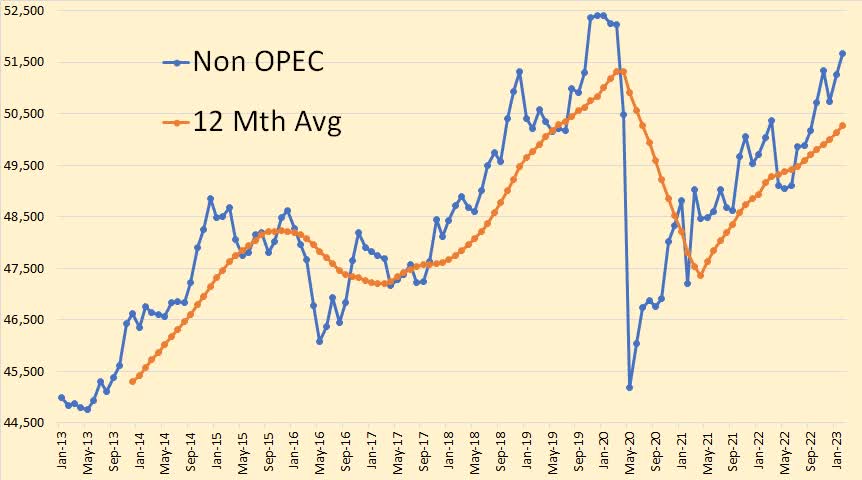
World Non-OPEC production increased by 395,000 barrels per day in February.
Since the world C+C peaked in November 2018, to current world data in February 2023, World C+C is down by 2,287,000 barrels per day. Non-OPEC production during that time period is actually up by 769,000 barrels per day, while OPEC production during that time period is down by 3,021,000 barrels per day.
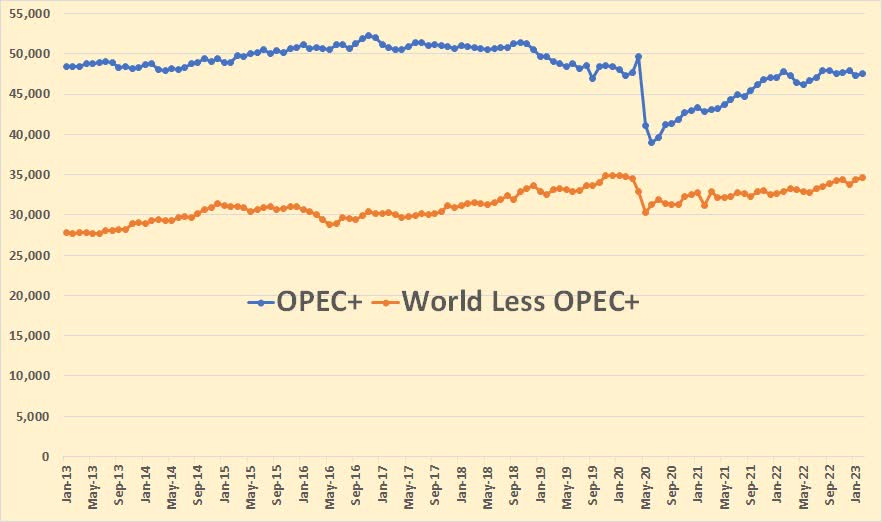
This zero-based chart gives us a better picture of things. OPEC+, as of February 2023, produced 58 percent of world oil C+C production while Non-OPEC+ produced 42 percent of world C+C production.
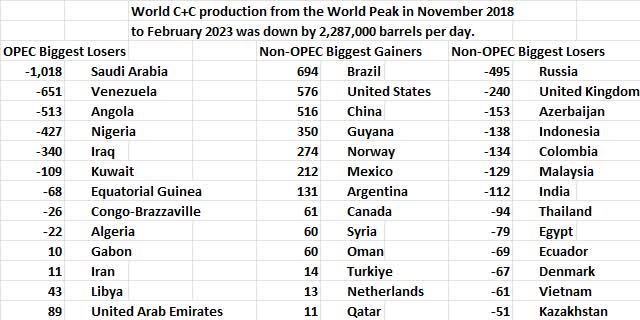
The data above is in thousands of barrels per day.
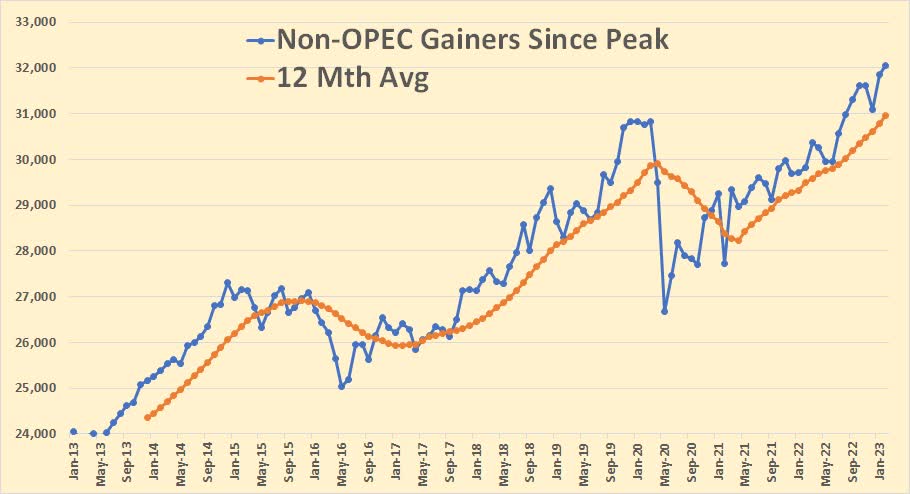
17 of the 77 Non-OPEC nations have increased C+C production since the November 2018 peak.
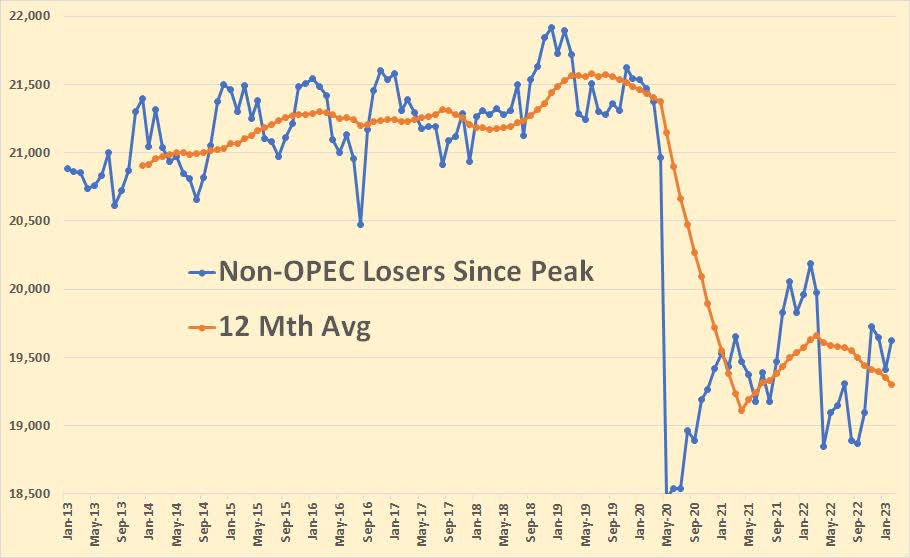
60 of the 77 Non-OPEC nations have lost production since the November 2018 peak. However, their total current production is almost 12.5 million barrels per day lower than the gainers.
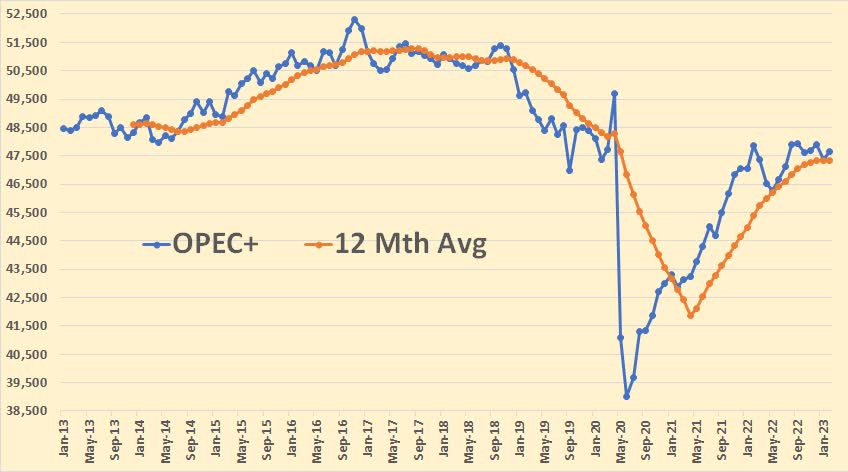
This is OPEC+ C+C through February 2023. They have pretty much plateaued for the last 13 months. This data is only through February. Reports have them down another 1 million barrels per day through May.
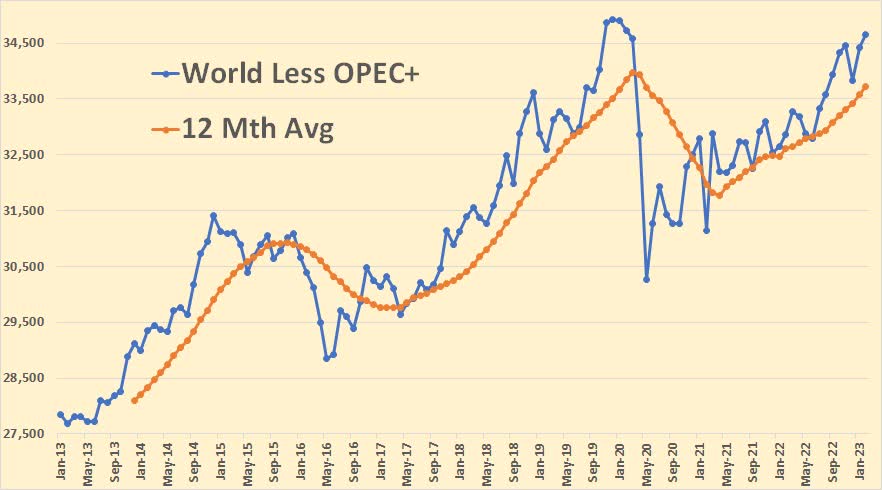
World less OPEC+ is back at pre-covid levels.
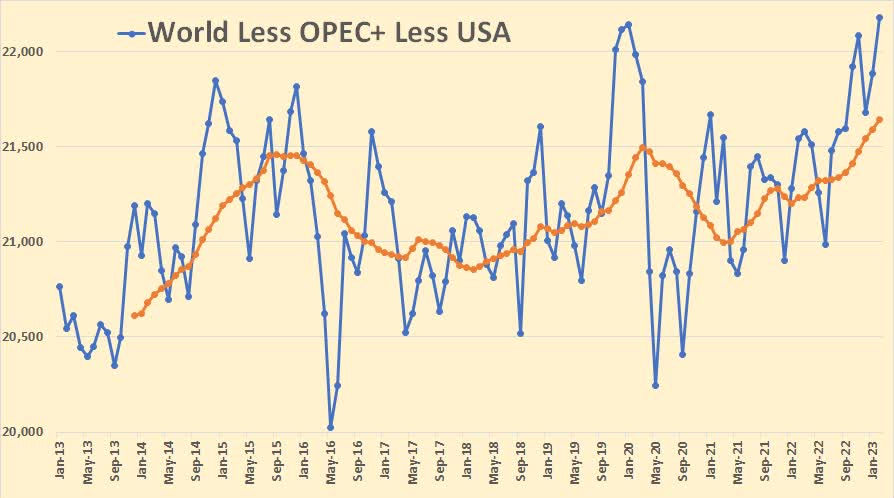
If you remove the USA from World less OPEC+, it looks hectic, but not very impressive.
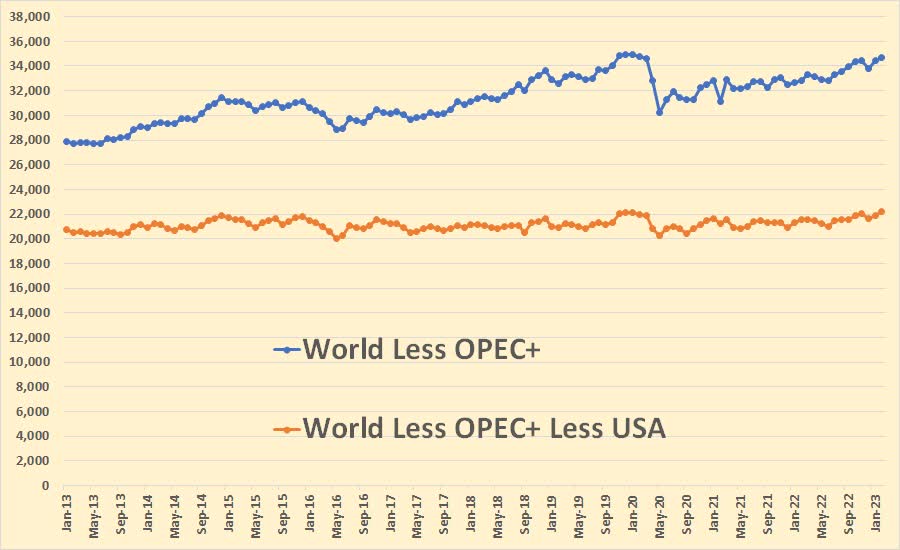
The above zero-based chart clears up things. It is obvious that World less OPEC+, less the USA has been almost flat for the last decade. Some nations have gained while others have waned. Meaning it is pretty much a wash. So… it is up to the USA and OPEC+ for gains or losses for future oil production.
OPEC+ stalled at about 3.5 million barrels per day below their peak in 2017. That was as of February. At that time, almost all were producing well below their quota. Now they are cutting a lot more.
I am not optimistic about the future of world oil production. Though OPEC+ cuts are now voluntary, there is little evidence that they can produce above their September pre-covid high of 47,936,000 C+C barrels per day. As of February, they were 300,000 barrels per day below that level. As of May, they are at least another 1 million barrels per day below that level.
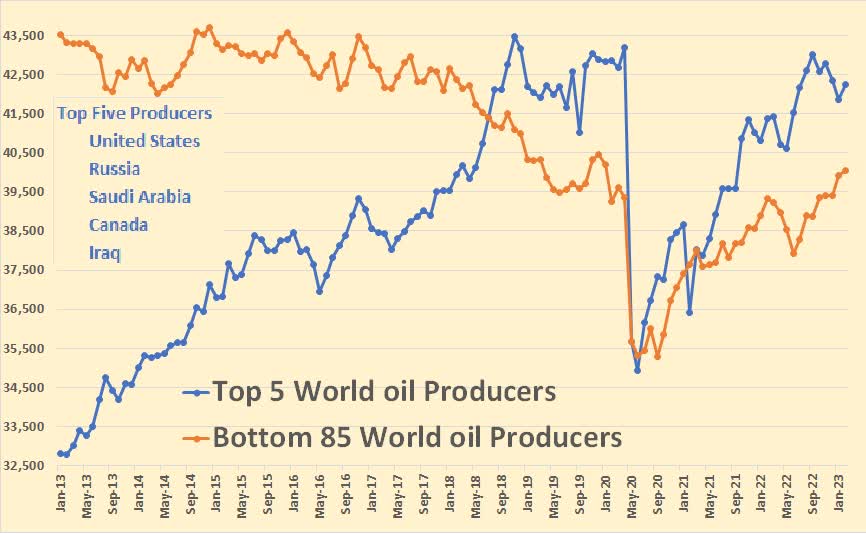
Above are the top 5 world oil producers and the bottom 85 world oil producers. The current top 5 were, in January 2013, 43% of world oil production, while the current bottom 85 producers were, on that date, 57% of world oil production. Ten years later, in February of this year, the top 5 producers are 51% of world oil production, while the bottom 85 producers were 49% of world oil production.
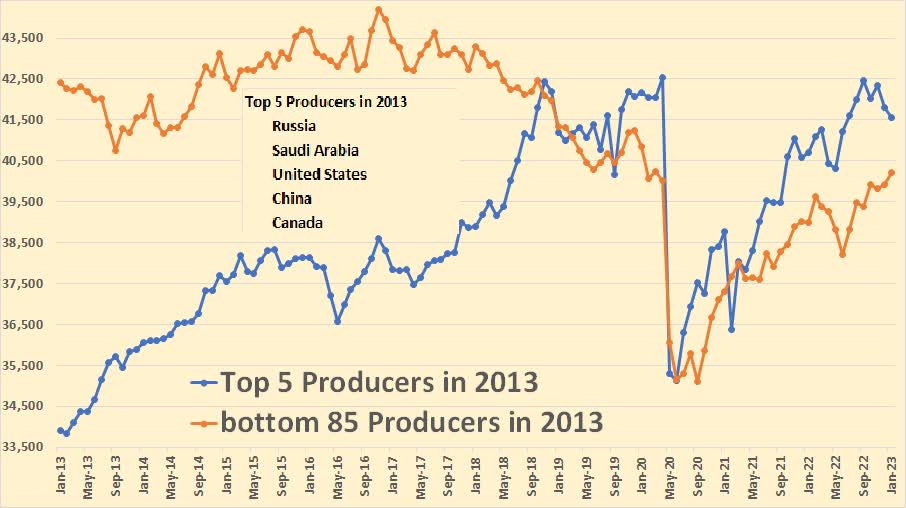
The top 5 world oil producers in 2013 look pretty much the same, except China was number 4 then and number 6 in 2013. Iraq was number 7 in 2013.
Conclusion: Whether world oil production waxes or wanes in the future depend pretty much on the world’s top producers. The cumulative production of the world’s lesser producers will continue to wane. It will be up to the world’s top three producers, the USA, Russia, and Saudi Arabia, as to whether world oil production waxes or wanes. I am not optimistic.
Original Post
Editor’s Note: The summary bullets for this article were chosen by Seeking Alpha editors.
Read the full article here


